
© 2017 iStock/verbaska_studio
As access to telemedicine grows, results from the 2018 Long-Term Care Trend poll show Americans age 40 and older have widespread comfort with the technology. Over half are comfortable using a live video service like Skype for a medication consultation or for ongoing management of a chronic condition. While telemedicine services may hold particular promise for older adults in need of long-term care, The Associated Press-NORC Center for Public Affairs Research survey finds that older Americans have some concerns, with the No. 1 concern being that it could result in lower-quality care.
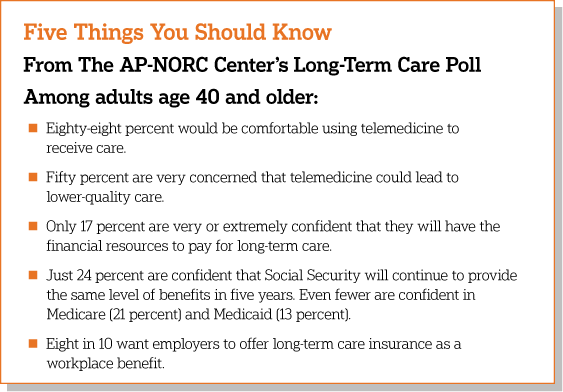
The sixth in an annual series of surveys, this poll also finds that older Americans continue to lack confidence in their ability to afford the costs of long-term care services and that few believe social safety net programs will provide a similar level of benefits five years down the road.
The majority of Americans age 65 and older will require at least some long-term care services and supports as they age, often as a result of chronic illness or disability.1 They often need assistance with daily activities such as eating, bathing, or remembering to take medicine. The need for long-term care services is expected to dramatically increase over the coming decades, as the U.S. population of adults age 65 and older is projected to nearly double.2 The “graying of America” raises important questions around how to fund and provide quality long-term care services and supports.
An array of policy proposals designed to improve long-term care financing continue to enjoy high levels of support among the nation’s older adults. In February 2018, Congress passed the Creating High-Quality Results and Outcomes Necessary to Improve Chronic (CHRONIC) Care Act, which will allow Medicare Advantage to cover more services for people who need a lot of long-term care.3 This legislation is very popular among older adults. Eighty-one percent support allowing individuals to get long-term care insurance through a Medicare Advantage or supplemental insurance plan. Policy proposals to support the nation’s informal caregivers—those family members and friends who regularly provide hours of unpaid care to support their older loved ones—also continue to enjoy widespread support.
Although few Americans have long-term care insurance, 84 percent of older adults say employers should offer it to their employees as a workplace benefit, similar to how some employers offer health, dental, or vision insurance. Majorities of Republicans, Democrats, and independents agree that long-term care insurance should be offered as a workplace benefit.
Since 2013, The AP-NORC Center has conducted annual surveys investigating older Americans’ experiences and attitudes regarding long-term care to contribute data to help policymakers, health care systems, and families address this issue.4 In prior years, the poll focused on Americans age 40 and older, revealing that a majority hold misperceptions about the likelihood they will need long-term care services in the future and about the cost of those services. Few older Americans have done substantial planning or saving for their future needs, and less than half have even talked about the topic with their family. A majority supports a variety of policy changes that would help in the financing of long-term care, as well as supporting changes in practice that favor a person-centered care approach.
The 2018 survey continues to track items from prior years of the poll while also exploring new topics, including preferences and concerns around telemedicine, a key component of the CHRONIC Care Act; perceptions of the number of older Americans who will need long-term care; actions taken to plan for the long-term care needs of loved ones; caregivers’ perceptions of the stress, sacrifices, and social and emotional support for informal caregiving; views on the availability of entitlement programs to support Americans’ long-term care needs; and support for workplace long-term care insurance benefits and other policy proposals.
For the first time, this year’s study also explored the perspectives of younger adults, those age 18 to 39, generating new insights on their views of long-term care and personal experiences with caregiving. The results comparing younger and older Americans are detailed in a separate report.5 In this report, the first section on views toward telemedicine includes findings for all adults—those age 18 to 39 and those age 40 and older. The rest of the report focuses on the trends for older Americans—those age 40 and older.
The AP-NORC Center conducted this study with funding from The SCAN Foundation. The poll includes 1,945 interviews with a nationally representative sample of Americans using the AmeriSpeak® Panel, including 423 adults age 18-39 and 1,522 adults age 40 and older.
Key themes and findings from this study are described below:
- Adults age 40 and older are just as likely as those age 18 to 39 to say they would be comfortable using at least one form of telemedicine, but they are slightly less comfortable communicating by text message for an urgent health concern compared to younger adults (22 percent vs. 29 percent).
- Support for telemedicine is high among informal caregivers—87 percent of current caregivers age 18 and older say they would be comfortable using at least one form of telemedicine for their older loved one.
- When it comes to concerns around telemedicine, 47 percent of adults age 18 and older are concerned about receiving low-quality care, 39 percent are concerned about the security of their health information or technical issues, and 31 percent have concerns about privacy.
- Just 35 percent of adults age 40 and older are able to correctly estimate that 7 in 10 Americans will need some form of long-term care as they age, while 54 percent underestimate the figure and 11 percent overestimate it.6
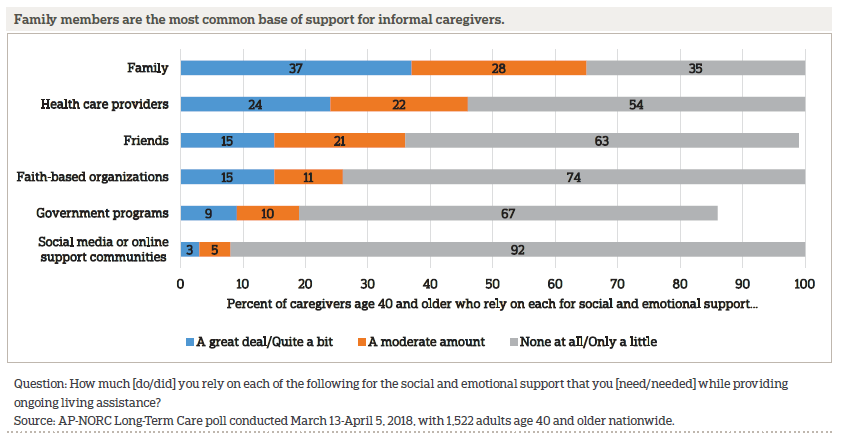
- When it comes to informal sources of support, 37 percent of older adult caregivers rely on their family and 15 percent on friends quite a bit or a great deal. In terms of more formal sources of support, a quarter rely on health care providers, and fewer depend on government programs or faith-based organizations. Hardly any make use of social media or online support communities.
- Although Social Security is adjusted for inflation, just 24 percent of older Americans are confident that Social Security benefits will remain at their current level in five years. Twenty-one say the same about Medicare, and just 13 percent say the same about Medicaid.
- Although few older adults have long-term care insurance, 84 percent of older adults say employers should offer long-term care insurance to their employees as a workplace benefit.
- The most popular long-term care policy proposal to help finance long-term care, with 81 percent of older adults in favor, is giving people the ability to get some long-term care coverage through a Medicare Advantage or supplemental insurance plan, as authorized by the CHRONIC Care Act.
Additional information, including the survey’s complete topline findings, can be found on The AP-NORC Center’s long-term care project website at www.longtermcarepoll.org.
AMERICANS ARE OPEN TO TELEMEDICINE BUT HAVE SOME CONCERNS ABOUT QUALITY.ꜛ
Telemedicine, also referred to as telehealth, is a growing method for the delivery of health care. Using some form of telecommunications technology, such as the internet or a phone, telemedicine allows patients to receive health care services remotely.7 While not all health care providers offer telemedicine services, they can help make health care accessible to people who live far from medical services or to those with limited mobility or transportation options. The CHRONIC Care Act expands telemedicine options for Medicare beneficiaries by allowing Medicare Advantage plans to cover additional telemedicine services, giving dialysis patients the ability to do monthly check-ins via telemedicine, and expanding diagnosis and treatment via telemedicine for stroke patients.8,9
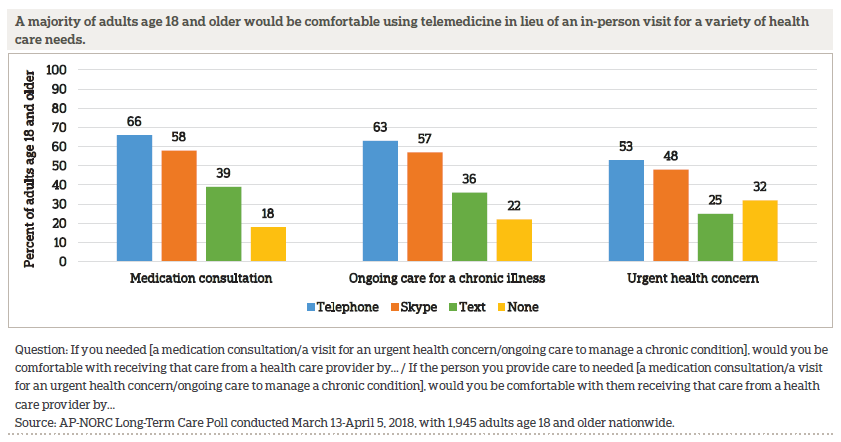
As access to telemedicine grows, this survey finds that most Americans age 18 and older are open to using telemedicine services, either for themselves or for an older loved one they provide care to, for a range of reasons—88 percent of adults are comfortable with the idea of using telemedicine for either a medical consultation, ongoing care to manage a chronic illness, or a visit for an urgent health concern.
More than half would be comfortable communicating using a live video service like Skype or FaceTime for a medication consultation or ongoing care to manage a chronic condition. While Medicare typically only covers live audio-video communication, majorities are also comfortable receiving medical care via talking on the phone for a medication consultation, for ongoing care to manage a chronic condition, or for an urgent health concern.10
Fewer Americans are comfortable with the idea of using text messaging, and 12 percent eschew the idea of using telemedicine altogether. Nearly 4 in 10 would be comfortable communicating via text for a medication consultation or ongoing care, and one quarter are comfortable with texting for an urgent health care concern.
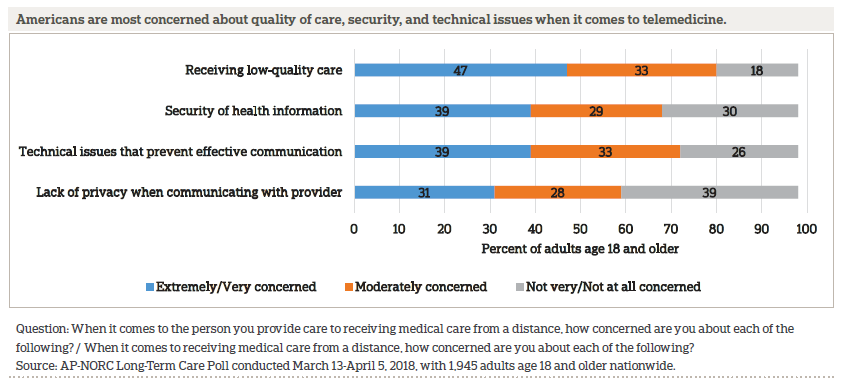
Americans do have some concerns about telemedicine. Nearly half are extremely or very concerned about receiving low-quality care. Four in 10 are concerned about the security of their health information or running into technical issues that prevent effective communication. And 3 in 10 have concerns about privacy.
Few differences emerge between adults age 40 and older and younger adults when it comes to comfort with telemedicine services. Those age 40 and older are just as likely as those age 18 to 39 to be comfortable using telemedicine services, and they are generally just as comfortable with each mode of communication. They also hold similar concerns about quality of care and concerns about the security of information. The one small exception is that adults age 40 and older are less likely to say they would be comfortable communicating by text message for an urgent health concern compared to younger adults (22 percent vs. 29 percent).
CAREGIVERS SUPPORT THE USE OF SOME TELEMEDICINE SERVICES FOR THEIR OLDER LOVED ONES.ꜛ
Informal caregivers, family members, and friends provide much of the long-term care their loved ones require to remain at home in the community as they age.
Support for telemedicine remains high among these current caregivers—87 percent would be comfortable using telemedicine services for at least one of three reasons for needing care asked about in the survey. The percentage who are comfortable with using at least one mode of telemedicine—either live video chatting, the phone, or text messaging—for each individual reason for needing care is similar to that of non-caregivers.
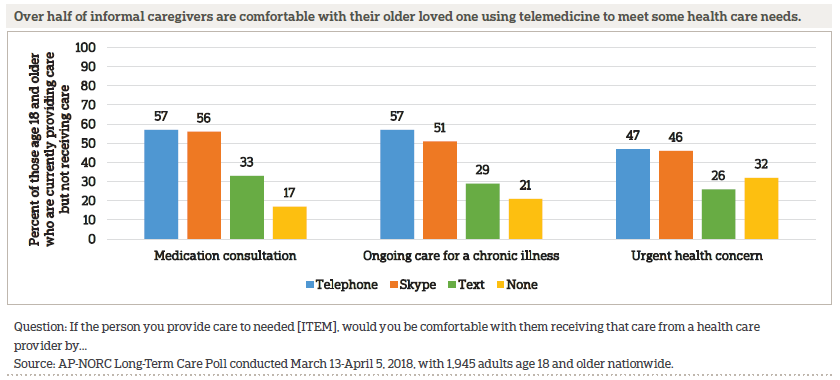
Caregivers hold similar concerns about telemedicine as those who do not provide care.
OLDER AMERICANS CONTINUE TO UNDERESTIMATE THE LIKELIHOOD THEY WILL NEED LONG-TERM CARE.ꜛ
More than half of adults age 40 and older underestimate the percentage of Americans over age 65 who will need some form of long-term care in their lifetime. Just 35 percent correctly estimate that 7 in 10 will need long-term care, while 53 percent underestimate the figure and 11 percent overestimate it.11
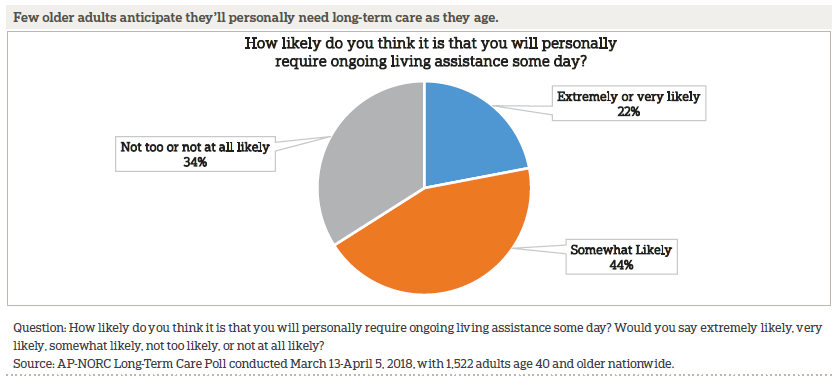
When it comes to their own personal likelihood of requiring care in their lifetime, about a fifth think it is extremely or very likely. This is consistent with prior years of the poll.
For 29 percent of older Americans, the idea of getting older is something they would rather not think about. Forty-four percent say growing older is something they are somewhat comfortable thinking about, and 26 percent are very comfortable thinking about it. The percent who say that aging is something they’d rather not think about remains unchanged since 2013.
A MAJORITY OF OLDER ADULTS REMAIN UNPREPARED FOR THE POSSIBILITY OF LONG-TERM CARE.ꜛ
Altogether, 35 percent of adults age 40 and older have discussed a friend or family member’s preferences for long-term care should that need arise. Twenty-nine percent have discussed the types of care their loved one wants, and 27 percent have discussed where their loved one would like to live while receiving the care.
A new question for 2018 asked whether older adults have had discussions about a friend or family member’s preferences for who would provide assistance, and 29 percent say they have discussed from whom their loved one would prefer to receive care.
When it comes to their own personal needs for long-term care, 64 percent have done little or no planning at all, 23 percent have done a moderate amount, and just 12 percent have done quite a bit or a great deal. This is largely unchanged from 2017 when 67 percent said they had not done much or any planning for their own personal care needs.
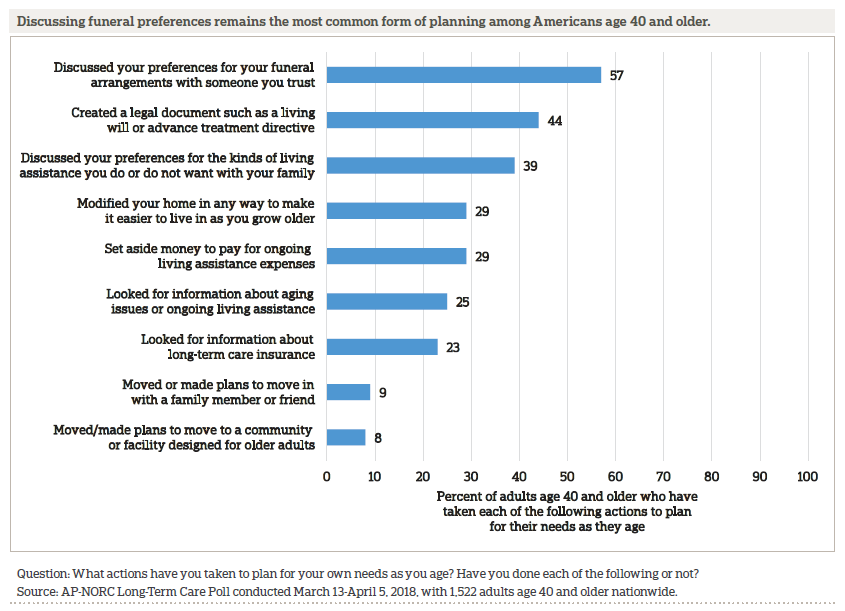
However, looking at individual planning actions, 80 percent of older adults report taking at least one step to prepare for aging, though the most common actions are for end-of-life care and not long-term care. These rates of reported planning actions are consistent with prior years of the poll.
FRIENDS AND FAMILY MEMBERS PROVIDE MOST LONG-TERM CARE, BUT FEW FEEL PREPARED TO TAKE ON A CAREGIVING ROLE.ꜛ
Overall, 9 percent of adults age 40 and older report receiving long-term care services and supports, either currently or at some point in the past. Those who have received long-term care tend to skew less educated and lower-income compared to the general population of older adults and are less likely to be employed or married.
Most long-term care recipients age 40 and older in the survey only receive help a few hours a week. Sixty-one percent received care for less than 10 hours a week, while 35 percent received care for 10 hours a week or more.
Among those who have received long-term care, most got it from family members (70 percent) or friends (36 percent). About half received care from a professional home health care aide. Few older adults are currently paying for long-term care, whether for themselves, a family member, or a friend. Just 1 in 10 say they are employing someone to provide in-home care.
Looking to the future, many adults age 40 and older anticipate that an aging family member or close friend will need long-term care in the next five years. Among those who are not current caregivers, nearly 7 in 10 say it is at least somewhat likely that someone close to them will need support, similar to the proportion who said this in 2017.
Among those who expect someone close to them to need care in the near term, about half expect to bear some of the responsibility of providing that care, either on their own or sharing the caregiving with someone else. Just 15 percent believe they will be responsible on their own, but that may be an overly optimistic expectation. A 2017 AP-NORC study of long-term caregivers found that one-third shouldered the caregiving responsibilities alone.12
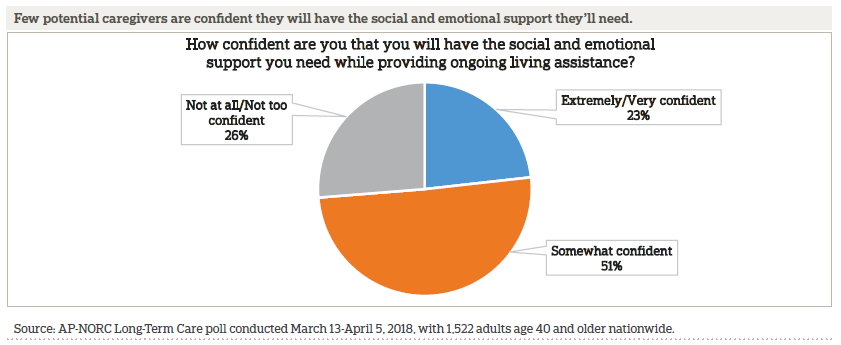
These prospective caregivers are not confident in their level of preparedness, however. Sixteen percent say they are very prepared to provide living assistance when the time comes, while 46 percent are somewhat prepared and 37 percent don’t feel very prepared. Compared to 2017, there is no change in how ready older Americans are to provide care.
Most older Americans who think they’ll provide care in the near future are unsure they will have the support they need.
CAREGIVING REQUIRES SOME SACRIFICES, AND FOR MANY, SOME STRESS.ꜛ
About 4 in 10 older adults have experience providing long-term care to a family member or close friend, either currently or in the past. Compared to the overall age 40 and older population, these informal caregivers tend to skew more female (59 percent vs. 41 percent male).
Informal caregivers age 40 and older provide a substantial amount of unpaid care for their older loved ones on a weekly basis. Sixty-three percent provide care for 10 hours a week or more, 18 percent between 5-10 hours a week, and 18 percent for 5 hours a week or less.
Providing this care takes an emotional toll on some but causes little stress for others. Caregivers are evenly split in finding their role to be extremely or very stressful (32 percent), moderately stressful (35 percent), or only a little or not at all stressful (33 percent). However, 54 percent of caregivers say they have most or all of the social and emotional support they need, 27 percent have some support, and just 19 percent have hardly any or none.
Caregivers age 40 to 54 are more likely than caregivers age 55 and older to experience stress (39 percent vs. 28 percent) and less often receive all the social and emotional support they need (43 percent vs. 60 percent). Many caregivers in their 40s and early 50s juggle work and caregiving or are dealing with the competing demands of caring for children and elderly parents.13,14
Nearly two-thirds of caregivers age 40 and older say they had to give up something to provide care. When asked to describe what they sacrificed, they most often mentioned free time (25 percent), time with family (14 percent), and a sense of self (14 percent).
When it comes to who they rely on for social and emotional support, 37 percent of caregivers age 40 and older rely on their family and 15 percent on friends quite a bit or a great deal. For more formal support, a quarter rely on health care providers and fewer depend on government programs or faith-based organizations. Hardly any make use of social media or online support communities.
OLDER AMERICANS BELIEVE THAT THE RESPONSIBILITY FOR PAYING FOR LONG-TERM CARE COSTS SHOULD BE SHARED ACROSS INDIVIDUALS, FAMILIES, PRIVATE INSURANCE, AND GOVERNMENT.ꜛ
When it comes to who should be responsible for paying for long-term care, older Americans say health insurance companies and Medicare should be the most involved.
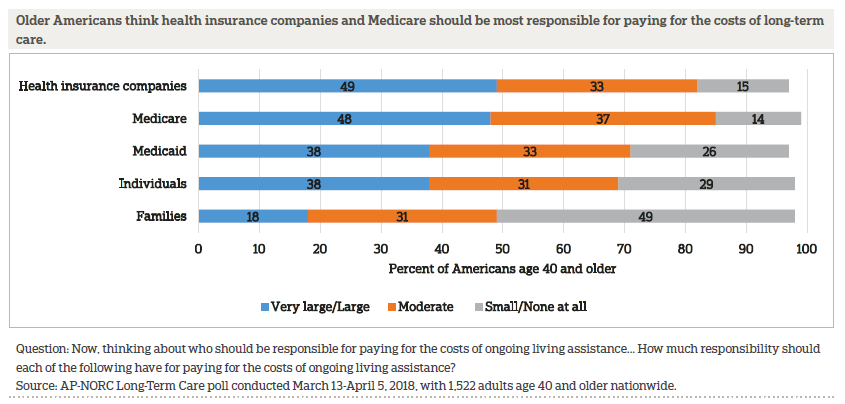
While the percentage of older Americans who say each of these sources should have at least a moderate amount of responsibility for paying for the costs of care has remained fairly stable since 2013, there have been some changes in the number who say health insurance companies and Medicare should bear a larger share of the burden. In 2013, 55 percent said health insurance companies should have a large or very large responsibility, and that number declined to 49 percent in 2018. Opinion has fluctuated more for Medicare. The number who say Medicare should have a large responsibility declined compared to last year, from 56 percent to 48 percent, but this is still a higher share of older Americans than in 2013 or 2014.
FEW ARE CONFIDENT IN THEIR ABILITY TO PAY FOR THEIR OWN CARE, AND MISPERCEPTIONS ABOUT HOW TO PAY FOR CARE PERSIST.ꜛ
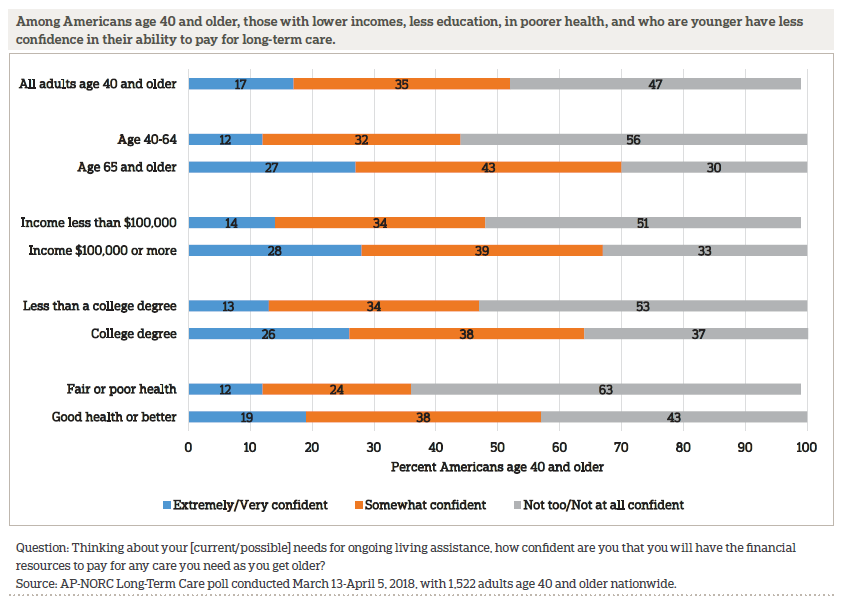
Older Americans lack confidence in their ability to pay for long-term care. Only 17 percent are very or extremely confident that they will have the financial resources to pay for long-term care, 35 percent say they are somewhat confident, and 47 percent say they are not too confident or not confident at all. These rates are steady compared to last year. There are differences in confidence by age, income, employment status, education, and current health.
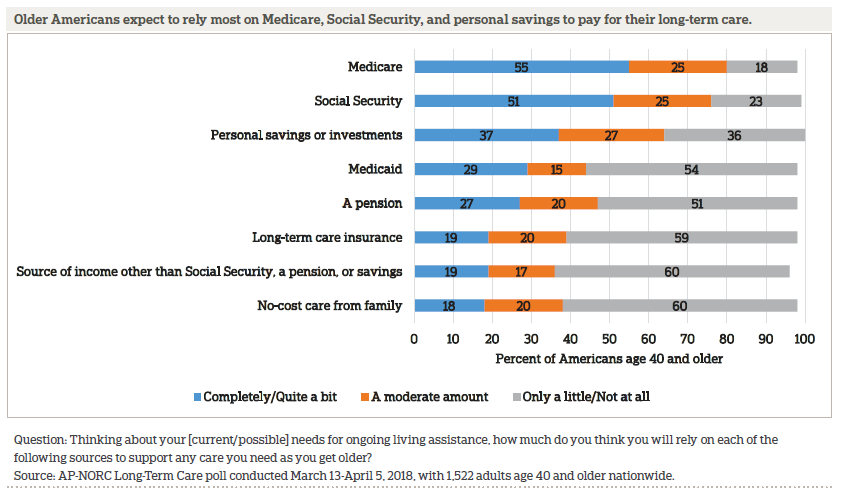
More than half of older Americans expect to rely on sources like Medicare and Social Security to pay for the costs of their care. Though Medicare covers doctors’ visits and hospital costs, it covers very few long-term care services outside those settings. Social Security, too, is often inadequate for most in need of care—the average yearly income for retirees from Social Security was about $17,000 in 2017,15 while the average nursing home costs about $86,000 annually and a home health aide costs about $49,000.16 Medicaid is the largest payer of long-term care costs, but just 29 percent say they will rely quite a bit or more on Medicaid.17
Aside from these government programs and savings, many older Americans expect to rely on sources like personal savings or investments, a pension, long-term care insurance, or other sources of income to pay for care. Eighteen percent also expect to rely on care from a family member at no cost. These rates largely remain unchanged compared to last year.
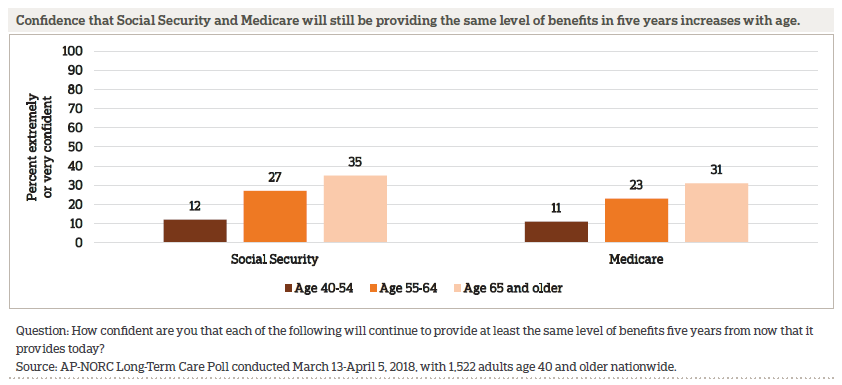
Even though many older adults expect to rely on government programs to pay for their care, there is skepticism that these programs will continue to provide the same benefits five years from now. Although it is adjusted for inflation, just 24 percent are confident that Social Security will continue to provide the same level of benefits in five years. Even fewer are confident in Medicare (21 percent) and Medicaid (13 percent).
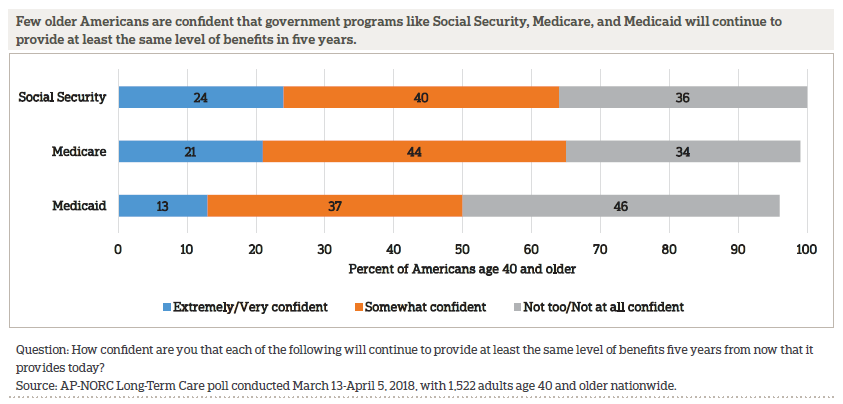
Those who are older are more confident that both Social Security and Medicare will still be providing the same level of benefits in five years.
WHILE FEW HAVE LONG-TERM CARE INSURANCE POLICIES TODAY, MOST THINK EMPLOYERS SHOULD OFFER THESE PLANS AS A WORKPLACE BENEFIT.ꜛ
Among older adults, 10 percent report that they are very or somewhat sure they have long-term care insurance, and another 3 percent think they might but are not sure. There has been little change since last year in the percent of those age 40 and older saying they have long-term care insurance.
Although few older adults have long-term care insurance, 84 percent of older adults say employers should offer long-term care insurance to their employees as a benefit, similar to how some employers offer health, dental, or vision insurance.
There is bipartisan support for employer-offered long-term care insurance, but Republicans are less likely than Democrats to support it. Eighty-seven percent of Democrats and 86 percent of independents say employers should offer long-term care insurance, compared with 79 percent of Republicans.
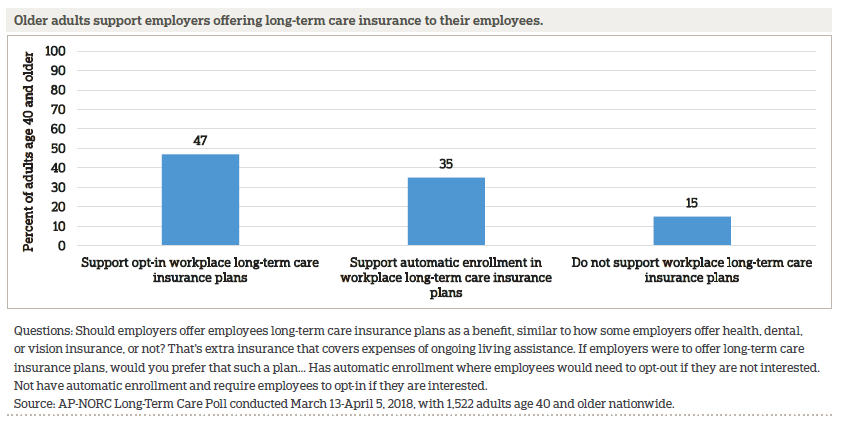
Among those who think employers should offer long-term care plans, 56 percent prefer the plan not have automatic enrollment and require employees to opt-in, while 41 percent would rather the plan have an automatic enrollment so that employees would need to opt-out. Overall, 35 percent support employers offering long-term care through automatic enrollment, 47 percent support it through an opt-in, and 15 percent oppose employers offering long-term care insurance plans.
PROPOSALS TO HELP ALLEVIATE THE COSTS OF LONG-TERM CARE FOR BOTH OLDER AMERICANS AND THEIR CAREGIVERS ENJOY BIPARTISAN SUPPORT.ꜛ
Older adults strongly favor five measures that could help reduce the costs of long-term care for individuals, and these policies all receive support from majorities of Democrats, Republicans, and independents.
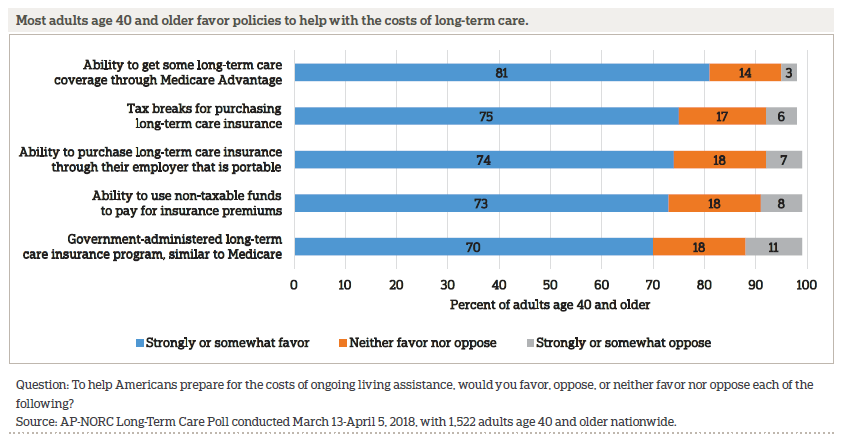
The most popular policy among older adults is giving some people the ability to get some long-term care coverage through a Medicare Advantage or supplemental insurance plan, as authorized by the CHRONIC Care Act, with more than 8 in 10 supporting it.
Similarly, about 3 in 4 older adults support each of the following measures: tax breaks for those who purchase long-term care insurance (75 percent), allowing employers to purchase portable long-term care insurance through their employer (74 percent), and allowing people to use non-taxable funds to pay for long-term care insurance premiums (73 percent).
The support for these three measures has remained relatively consistent since 2014, with around 7 in 10 older adults favoring each of them every year.
From 2013 to 2017, support for a government-administered long-term care plan similar to Medicare increased from 51 percent to 70 percent. Support for such a plan remains high in 2018.
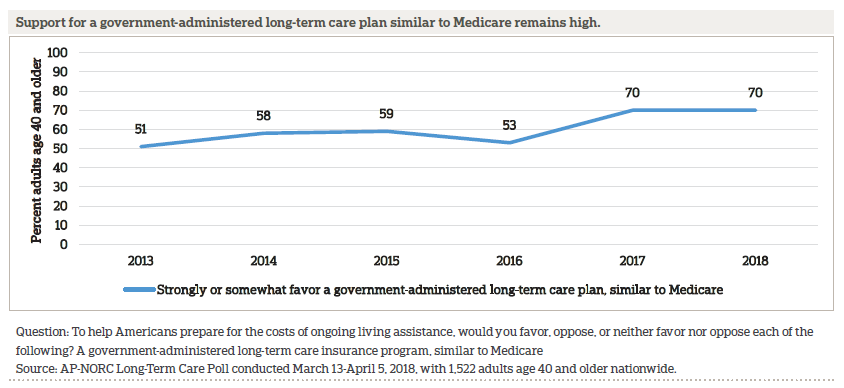
A government-administered long-term care plan similar to Medicare receives bipartisan support, but Democrats (80 percent) are more likely to favor it than independents (69 percent) or Republicans (59 percent).
There is also strong bipartisan support among older adults for policies to help Americans prepare for the cost of providing ongoing living assistance.
The most widely favored policy is providing tax breaks for people who provide care to family members, which is backed by 84 percent of adults age 40 or older.
More than 3 in 4 older adults also support: paid temporary leave programs to care for a family member (80 percent), a Medicare benefit that provides temporary care if the caregiver and the care recipient live together and are both Medicare beneficiaries (79 percent), tax breaks for employers who provide paid family leave (78 percent), and changing Social Security rules to give earnings credit to caregivers who are out of the workforce (76 percent).
Support among adults age 40 and older for these policies to assist with the costs of providing long-term care has remained stable in recent years, and there has not been any significant change in attitudes since 2016.
Although all five measures receive bipartisan backing from older adults, Democrats are more supportive of a few of the policies. In particular, 86 percent of Democrats favor paid temporary leave to care for a family member, compared with 75 percent of Republicans and 72 percent of independents. Additionally, 81 percent of Democrats support tax breaks for employers who provide paid family leave to workers versus 75 percent of Republicans. Seventy-six percent of independents support this.
THOSE WHO HAVE EXPERIENCE WITH PERSON-CENTERED CARE PRACTICES SAY THOSE PRACTICES HAVE IMPROVED THEIR CARE.ꜛ
This survey asked about care managers and individualized care plans, two aspects of the “person-centered care” approach to health care and support services. Those who regularly receive care from two or more doctors as part of their current care needs were asked about their own experience with person-centered care approaches, while those currently providing long-term care were asked about the care experience of their loved one.
Of the 14 percent of older adults with current experience receiving or providing care from two or more providers, 54 percent have a single care manager who serves as their point of contact and can coordinate all aspects of care, and 47 percent have an individualized care plan designed to take into account personal goals and preferences for care. Sixty-nine percent have at least one of these, and 32 percent have both.
Those with a single care manager have positive things to say about it—47 percent say it has improved care a lot, and another 37 percent say it has improved care a little. Just 16 percent say it has not improved care at all. Those with an individualized care plan are also generally happy with it—42 percent say it has improved care a lot, 48 percent say it has improved care a little, and just 7 percent say it hasn’t improved care at all.
Those without these person-centered care approaches expect that it would improve their care if they had access to them. Thirty-six percent say having a single care manager would improve their care a lot, and 47 percent say it would improve their care a little. Just 15 percent say it would not improve their care at all. Similarly, 33 percent say an individualized care plan would improve their care a lot, while 46 percent say it would improve their care a little. Just 20 percent would not expect it to improve their care at all.
ABOUT THE STUDYꜛ
Study Methodology
This study, funded by The SCAN Foundation, was conducted by The Associated Press-NORC Center for Public Affairs Research. Data were collected using AmeriSpeak®, NORC’s probability-based panel designed to be representative of the U.S. household population. During the initial recruitment phase of the panel, randomly selected U.S. households were sampled with a known, non-zero probability of selection from the NORC National Sample Frame and then contacted by U.S. mail, email, telephone, and field interviewers (face-to-face). The panel provides sample coverage of approximately 97 percent of the U.S. household population. Those excluded from the sample include people with P.O. Box only addresses, some addresses not listed in the USPS Delivery Sequence File, and some newly constructed dwellings. Of note for this study, the panel may exclude recipients of long-term care who live in some institutional types of settings, such as skilled nursing facilities or nursing homes, depending on how addresses are listed for the facility. Staff from NORC at the University of Chicago, The Associated Press, and The SCAN Foundation collaborated on all aspects of the study.
Interviews for this survey were conducted between March 13 and April 5, 2018, with adults age 18 and older representing the 50 states and the District of Columbia. Panel members were randomly drawn from AmeriSpeak, and 1,945 completed the survey—1,588 via the web and 357 via telephone. For purposes of analysis, adults age 40 and older and Hispanic older adults were sampled at a higher rate than their proportion of the population, then weighted back to their proper proportion in the survey, according to the most recent Census. Interviews were conducted in both English and Spanish, depending on respondent preference. Respondents were offered a small monetary incentive ($3) for completing the survey.
The final stage completion rate is 30.0 percent, the weighted household panel response rate is 33.7 percent, and the weighted household panel retention rate is 88.1 percent, for a cumulative AAPOR response rate 3 of 8.9 percent. The overall margin of sampling error is +/- 3.3 percentage points at the 95 percent confidence level, including the design effect. The margin of sampling error for the 1,522 completed interviews with adults age 40 and older is +/- 3.3 percentage points at the 95 percent confidence level, including the design effect. The margin of sampling error for the 458 completed interviews with Hispanic adults age 18 and older is +/- 9.5 percentage points at the 95 percent confidence level, including the design effect. The margin of sampling error for the 423 completed interviews with adults ages 18 to 39 is +/- 6.7 percentage points at the 95 percent confidence level, including the design effect.
Once the sample has been selected and fielded, and all the study data have been collected and made final, a poststratification process is used to adjust for any survey nonresponse as well as any non-coverage or under- and oversampling resulting from the study specific sample design. Poststratification variables included age, gender, census division, race/ethnicity, and education. Weighting variables were obtained from the 2017 Current Population Survey. The weighted data reflect the U.S. population of adults age 18 and over.
All analyses were conducted using STATA (version 14), which allows for adjustment of standard errors for complex sample designs. All differences reported between subgroups of the U.S. population are at the 95 percent level of statistical significance, meaning that there is only a 5 percent (or less) probability that the observed differences could be attributed to chance variation in sampling. Additionally, bivariate differences between subgroups are only reported when they also remain robust in a multivariate model controlling for other demographic, political, and socioeconomic covariates.
A comprehensive listing of all study questions, complete with tabulations of top-level results for each question, is available on The AP-NORC Center for Public Affairs Research long-term care website: www.longtermcarepoll.org.
Contributing Researchers
From NORC at the University of Chicago
Jennifer Benz
Jennifer Titus
Dan Malato
Liz Kantor
David Sterrett
Emily Alvarez
Jessica Bielenberg
Trevor Tompson
From The Associated Press
Emily Swanson
About The Associated Press-NORC Center for Public Affairs Research
The AP-NORC Center for Public Affairs Research taps into the power of social science research and the highest-quality journalism to bring key information to people across the nation and throughout the world.
- The Associated Press (AP) is the world’s essential news organization, bringing fast, unbiased news to all media platforms and formats.
- NORC at the University of Chicago is one of the oldest and most respected, independent research institutions in the world.
The two organizations have established The AP-NORC Center for Public Affairs Research to conduct, analyze, and distribute social science research in the public interest on newsworthy topics, and to use the power of journalism to tell the stories that research reveals.
The founding principles of The AP-NORC Center include a mandate to carefully preserve and protect the scientific integrity and objectivity of NORC and the journalistic independence of AP. All work conducted by the Center conforms to the highest levels of scientific integrity to prevent any real or perceived bias in the research. All of the work of the Center is subject to review by its advisory committee to help ensure it meets these standards. The Center will publicize the results of all studies and make all datasets and study documentation available to scholars and the public.
Footnotesꜛ
1. U.S. Department of Health and Human Services. 2017. How Much Care Will You Need? https://longtermcare.acl.gov/the-basics/how-much-care-will-you-need.htmlꜛ
2. Vespa, Jonathan, David M. Armstrong, and Lauren Medina. 2018. Demographic turning points for the United States: Population projections for 2020 to 2060. Current Population Reports, P25-1144. Washington, DC: U.S. Census Bureau. https://www.census.gov/content/dam/Census/library/publications/2018/demo/P25_1144.pdfꜛ
3. Bipartisan Budget Act of 2018, Pub. L.115- 123. 2018. https://www.congress.gov/115/bills/hr1892/BILLS-115hr1892enr.pdfꜛ
4. In 2013-2016, interviews were conducted through a random digit dial telephone survey on landlines and cell phones with samples of adults age 40 and older. In 2017-2018, interviews were conducted via either web or phone using the AmeriSpeak Panel, the probability-based panel of NORC at the University of Chicago. Reports and topline findings for all years can be found at https://longtermcarepoll.org/Pages/Default.aspx.ꜛ
5. The AP-NORC Center for Public Affairs Research. 2018. Younger Adults’ Experiences and Views on Long-Term Care. https://www.longtermcarepoll.org/project/younger-adults-experiences-and-views-on-long-term-care/.ꜛ
6. U.S. Department of Health and Human Services. 2017. How Much Care Will You Need? https://longtermcare.acl.gov/the-basics/how-much-care-will-you-need.htmlꜛ
7. American Telemedicine Association. 2018. About Telemedicine. http://www.americantelemed.org/main/about/telehealth-faqs-ꜛ
8. Senate Finance Committee. 2017. CHRONIC Care Legislation Improves Care for Medicare Beneficiaries. https://www.finance.senate.gov/imo/media/doc/CHRONIC%20Care%20Act%20of%202017%20One-Pager%204.6.17.pdfꜛ
9. Bipartisan Budget Act of 2018, Pub. L.115- 123. 2018. https://www.congress.gov/115/bills/hr1892/BILLS-115hr1892enr.pdfꜛ
10. Center for Medicare and Medicaid Services. 2017. Telehealth Services. https://www.cms.gov/Outreach-and-Education/Medicare-Learning-Network-MLN/MLNProducts/downloads/TelehealthSrvcsfctsht.pdfꜛ
11. U.S. Department of Health and Human Services. 2017. How Much Care Will You Need? https://longtermcare.acl.gov/the-basics/how-much-care-will-you-need.htmlꜛ
12. The AP-NORC Center for Public Affairs Research. 2017. Long-Term Caregiving: The Types of Care Older Americans Provide and the Impact on Work and Family. https://www.longtermcarepoll.org/project/long-term-caregiving-the-types-of-care-older-americans-provide-and-the-impact-on-work-and-family/ꜛ
13. Neergaard, Lauran. Associated Press. July 9, 2015. “Poll: Sandwich generation worried about own long-term care.” http://www.longtermcarepoll.org/poll-sandwich-generation-worried-about-own-long-term-care/ꜛ
14. The AP-NORC Center for Public Affairs Research. 2017. Long-Term Caregiving: The Types of Care Older Americans Provide and the Impact on Work and Family. https://www.longtermcarepoll.org/project/long-term-caregiving-the-types-of-care-older-americans-provide-and-the-impact-on-work-and-family/ꜛ
15. Social Security Administration. 2018. Fact Sheet: Social Security. https://www.ssa.gov/news/press/factsheets/basicfact-alt.pdfꜛ
16. Genworth Financial. 2017. Genworth 2017 Cost of Care Survey. https://www.genworth.com/about-us/industry-expertise/cost-of-care.htmlꜛ
17. U.S. Department of Health and Human Services. 2017, Who Pays for Long-Term Care? https://longtermcare.acl.gov/the-basics/who-pays-for-long-term-care.htmlꜛ