
©2016 Shutterstock.com/Chutima Chaochaiya
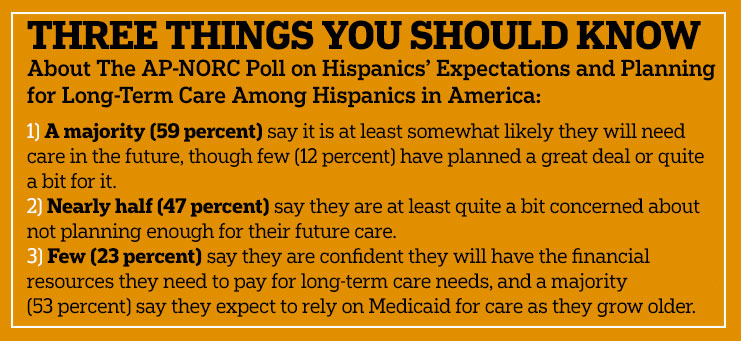
Results from a 2015 study of long-term care attitudes and behaviors among Americans age 40 and older reveal several key differences between Hispanics and non-Hispanics. Very few Hispanics report planning for long-term care, and they are worried about the lack of preparation. Nearly half say they are concerned about not planning enough compared to a third of non-Hispanics. Worry about planning and the lack of specific planning actions are especially acute among low-income Hispanics.
In 2015, The Associated Press-NORC Center for Public Affairs Research, with funding from The SCAN Foundation, completed the third in a series of studies assessing the aging population’s attitudes about and personal experiences with long-term care in the United States. Since 2013, these studies have found that many older Americans expect to one day need long-term care, though they have done little to prepare and lack knowledge and confidence regarding the financial aspects of care. The 2015 study includes 1,735 interviews with a nationally representative sample of adults age 40 and older, including oversamples of 419 Hispanics and 460 Californians age 40 and older.
This report focuses on Hispanics’ attitudes and experiences with long-term care in America in 2015. The U.S. Census projects that the Hispanic population in the United States will more than double by the year 2060, far outpacing the growth of the non-Hispanic population.1 By then, Hispanics are expected to comprise about 21 percent of the U.S. population age 65 and older.2 Through an oversample of Hispanics age 40 and older, The AP-NORC Center has conducted a thorough and rigorous analysis of this important, growing demographic group. We find several changes to this group’s expectations and experiences with long-term care compared to past years and that Hispanics’ attitudes and behavior diverge from non-Hispanics in several important ways.
Key findings among Hispanics age 40 and older include:
- Six in 10 Hispanics say it is at least somewhat likely they will need ongoing living assistance someday, which is similar to adults overall.
- Just 1 in 10 Hispanics report having done a great deal or quite a bit of planning for their ongoing living assistance needs while 6 in 10 have done only a little or none at all. These rates are comparable to those of the country as a whole.
- However, the number who are not planning is on the decline from 2014, with more Hispanics saying they have undertaken specific planning actions like setting aside money to pay for long-term care and looking up information on aging issues and ongoing living assistance in 2015 compared to 2014.
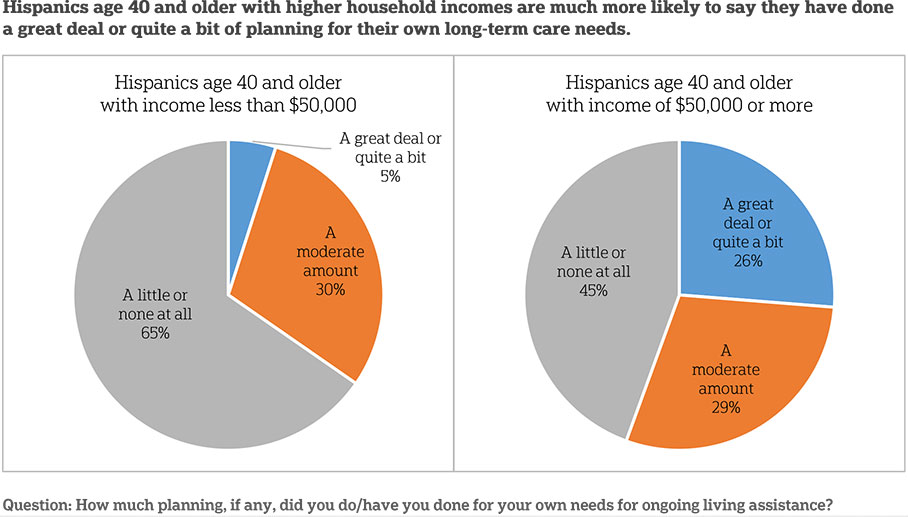
- Lower-income Hispanics are the least likely to be planning for care. Those with incomes of at least $50,000 are more than five times as likely as those with lower incomes to report that they are doing much planning for their own long-term care needs (26 percent vs. 5 percent).
- More Hispanics (47 percent) than non-Hispanics (32 percent) say they are either a great deal or quite a bit concerned about not planning enough for their future care.
- Less than a quarter of Hispanics express confidence that they will have the financial resources to pay for their own care as they get older.
- A majority (53 percent) of Hispanics expect to rely on Medicaid for ongoing living assistance someday.
Hispanics Anticipate Personally Needing Ongoing Living Assistance As They Age At A Rate Similar To Other Americans.ꜛ
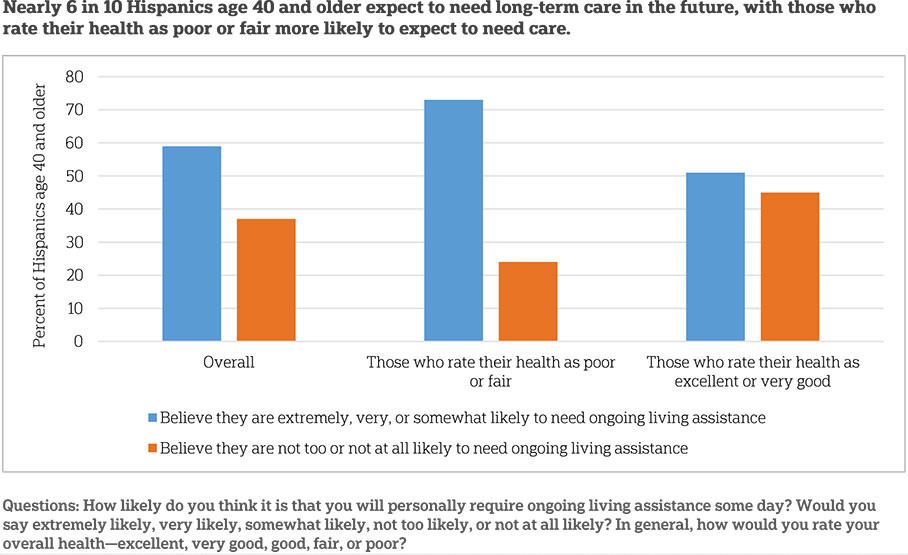
About 1 in 10 Hispanics age 40 and older say they are currently receiving some type of ongoing living assistance, such as help with things like keeping house, cooking, bathing, getting around, or just having someone to check in to see that everything is okay. Of those who are not currently receiving this kind of assistance, a majority (59 percent) say it is at least somewhat likely they will need it in the future. Just 37 percent say they are not too likely or not at all likely to need it. Hispanics anticipate needing ongoing living assistance at a rate similar to other Americans, 52 percent of whom say they are at least somewhat likely to need care.
There has been a decline in the last year in the number of Hispanics who say they are at least somewhat likely to need assistance (70 percent in 2014 vs. 59 percent in 2015), and the drop is consistent with national trends (60 percent in 2014 vs. 53 percent in 2015).
Hispanics’ beliefs about needing living assistance in the future are related to their experiences with long-term care, including experiences being a provider or a recipient of such care, and to their personal health. Hispanics with experience with long-term care are more likely than those without experience to report they will need ongoing living assistance in the future (68 percent vs. 51 percent). In regards to health, 73 percent of Hispanics who rate their health as fair or poor anticipate needing long-term care in the future compared with 40 percent of Hispanics who rate their health as very good or excellent.
Few Hispanics Say They Have Taken Action To Plan For Ongoing Living Assistance, With Especially Low Rates Among Those With Low Incomes.ꜛ
While a majority of Hispanics age 40 and older expect to need long-term care in the future, few have done much planning for their own ongoing living assistance needs. When asked about their planning behavior generally, just 12 percent say they have done a great deal or quite a bit of planning, whereas a majority says they have done only a little planning or none at all (59 percent). Nationally, general planning rates are similar. Twenty-one percent say they have done a great deal or quite a bit of planning, and 54 percent say they have done only a little or none at all.
When asked about specific planning behaviors, Hispanics age 40 and older frequently say they have not taken action. Just 3 in 10 (31 percent) Hispanics age 40 and older report that they have discussed their preferences for ongoing living assistance with their families. Only a quarter (25 percent) say they have set aside money to pay for their own ongoing living assistance needs. Less than 2 in 10 (16 percent) have looked for information about long-term care insurance, and this rate is lower than among non-Hispanics (30 percent). Finally, less than 2 in 10 have sought out information on aging issues and ongoing living assistance (15 percent).
Levels of planning and likelihood of reporting specific planning actions are associated with income, experience with long-term care, and education among Hispanics age 40 and older.
Differences in general planning by income are striking. Hispanics age 40 and older with household incomes of at least $50,000 are five times as likely as those with incomes of less than $50,000 to report that they have done a great deal or quite a bit of planning for their own long-term care needs (26 percent vs. 5 percent). On the other hand, the majority of those with incomes of less than $50,000 say they have done only a little planning or none at all compared to less than half of those with incomes of at least $50,000 (66 percent vs. 44 percent). Hispanics across both income groups report similar rates of moderate planning (29 percent and 30 percent).
Hispanics age 40 and older with higher incomes are much more likely to say they have taken two specific planning actions. Nearly half (49 percent) of Hispanics with household incomes of $50,000 or more have set aside money for ongoing living assistance, and 45 percent have discussed their preferences for long-term care with their families. These rates fall to 11 percent and 24 percent, respectively, for those with incomes under $50,000.
Prior experience with long-term care is also associated with increased general planning for one’s own ongoing living assistance needs. Those with long-term care experience are more likely to say they have done at least a moderate amount of planning than those with no such experience (47 percent vs. 34 percent). Those with no long-term care experience are more likely to report having done only a little or no planning compared to those who do have such experience (66 percent vs. 52 percent). Additionally, those with experience with long-term care are twice as likely as those without experience to say they have looked for information on aging issues and ongoing living assistance (21 percent vs. 10 percent).
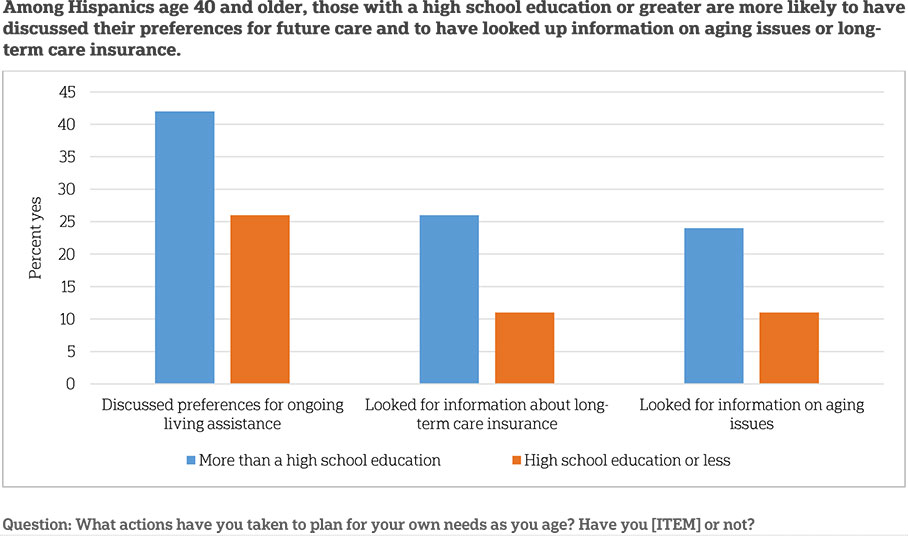
Independent of income, educational attainment is associated with levels of three specific planning actions among Hispanics age 40 and older. Those with higher than a high school education are more likely than those with a high school degree or less to say they have discussed preferences for long-term care with their family (42 percent vs. 26 percent), sought out information on long-term care insurance (26 percent vs. 11 percent), or looked for information about aging issues and ongoing living assistance (24 percent vs. 11 percent).
These low rates of planning go hand-in-hand with high levels of concern among older Hispanics about a lack of preparation for long-term care, and they worry at higher rates than non-Hispanics. Nearly half (47 percent) say they are either a great deal or quite a bit concerned about not planning enough compared to just 32 percent of non-Hispanics. Hispanics who describe their health as fair or poor show much higher levels of concern than those in better health.
With Hispanics age 40 and older reporting low levels of overall planning for ongoing living assistance, low rates of specific planning actions, and high levels of concern over their lack of preparation, most have at least done some planning. Nearly three-quarters (74 percent) have taken at least one planning action among those listed above as well as several others, such as discussing preferences for funeral arrangements or creating a living will. This is lower than the rate among non-Hispanics (86 percent), however.
Differences in likelihood of taking at least one planning action vary by education, income, and experience with long-term care. Those with a college degree or more are more likely to have taken one planning action (89 percent) compared to those who have not graduated college (71 percent). Those who live in households with incomes of $50,000 or more plan more frequently (90 percent) than those who live in households that earn less than $50,000 a year (68 percent). And those with experience either providing, receiving, or paying for ongoing living assistance (80 percent) are more likely than those without experience (68 percent) to have taken at least one planning action.
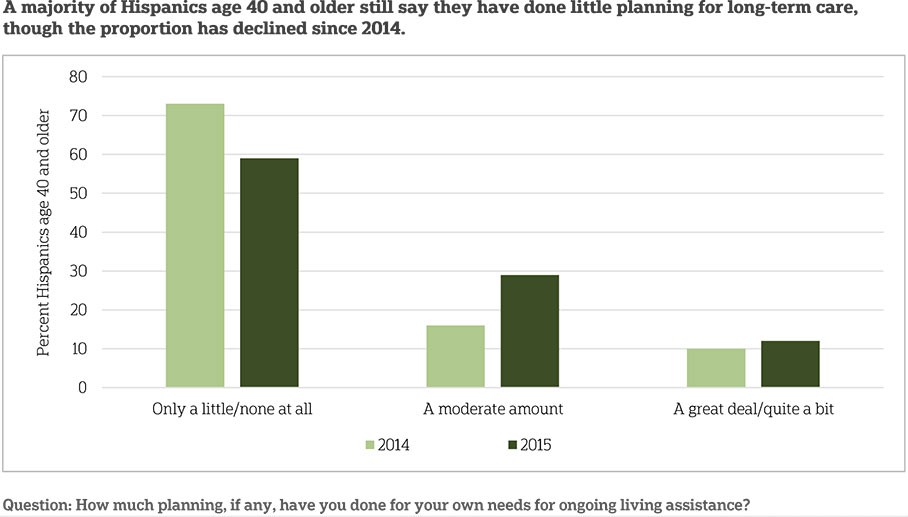
While Hispanics Show Low Levels Of Planning Overall, There Has Been An Increase In Planning Among The Group Since 2014.ꜛ
As noted above, a majority of Hispanics age 40 and older continue to say they have done little or no general planning for their own needs for ongoing living assistance. But, this proportion is on the decline. In 2014, 73 percent said they have done little or no planning; however, in 2015 only 59 percent say the same. Twenty-nine percent of Hispanics age 40 and older say they have done a moderate amount of planning in 2015 compared to 16 percent who said the same in 2014. These changes mirror trends seen in the country as a whole.
While more Hispanics age 40 and older say they have started planning generally for long-term care, they also report undertaking two specific actions to plan for their future care more frequently than in past years. Twenty-five percent of older Hispanics now report setting aside money for ongoing living assistance, up from 15 percent in 2014. Fifteen percent report having looked for information on aging issues and ongoing living assistance, an increase from just 10 percent in 2014. These trends stand out in comparison to the United States as a whole, as such changes are not observed nationwide.
Despite increases in planning behaviors among older Hispanics, their level of worry about not planning enough for their future care remains similar to previous years.
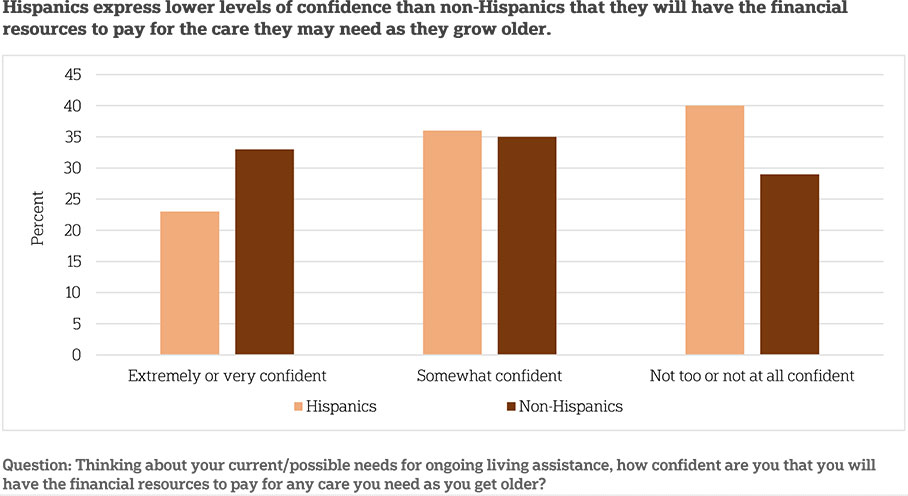
In The Face Of The Steep Financial Obligations Of Long-Term Care, Hispanics Lack Confidence In Their Ability To Pay For Their Ongoing Living Assistance Needs.ꜛ
With median costs of $45,760 per year for ongoing care at home by a home health care aide, and $91,250 per year for nursing home care, affording the services associated with long-term care can be a challenge.3 Facing these potential financial obligations, Hispanics age 40 and older express little confidence that they will have the resources to pay for the care they may need as they grow older.
Just 23 percent of older Hispanics say they are very or extremely confident they will have the financial resources to pay for the care they need as they get older while 40 percent say they are not too or not at all confident. Hispanics’ confidence levels are lower than those seen among non-Hispanics, where 33 percent say they are very or extremely confident, and just 29 percent say they are not confident. These proportions have not changed significantly since 2014.
Lower-income Hispanics particularly lack confidence in their future ability to pay for care. More than half (52 percent) of Hispanics age 40 and older who earn less than $50,000 a year say they are not too or not at all confident they will have the financial resources necessary for their own long-term care versus just 19 percent who earn $50,000 a year or more.
Those who report poorer health have more doubts than those in better health about their ability to pay for care in the future. Fifty-six percent of Hispanics age 40 and older who describe their health as poor or fair say they are not confident they will have the financial resources to pay for care. Just 37 percent of those in good health and 23 percent of those in very good or excellent health say the same.
These doubts appear to translate into concern among Hispanics age 40 and older about their ability to pay for care. Nearly half (48 percent) of Hispanics age 40 and older say they are quite a bit or a great deal concerned about being able to pay for the care they will need as they grow older. This is similar to the 52 percent of Hispanics who felt this way in 2014 and is higher than non-Hispanics, only 36 percent of whom express this level of concern.
Again, reported health is associated with levels of concern. Hispanics who describe their health as poor or fair (61 percent) are much more likely than those in good health (46 percent) or very good or excellent health (35 percent) to say they are a great deal or quite a bit concerned about paying for their care in the future.
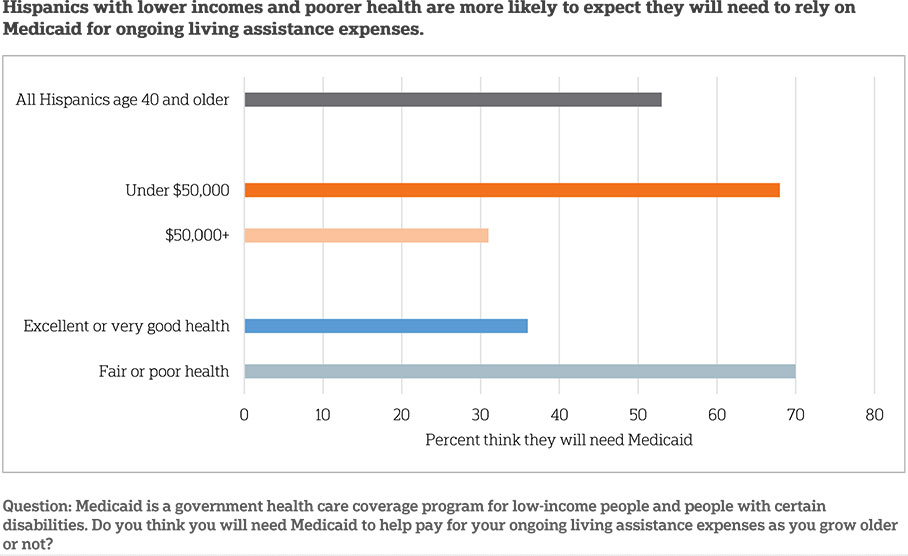
When It Comes To Financing Long-Term Care, Many Hispanics—Especially Those With Low Incomes And In Poor Health—Expect Support From Medicaid.ꜛ
As Hispanics age 40 and older lack confidence in their ability to pay for their future long-term care needs, they expect to rely on outside sources like Medicaid as they age.
In 2013, total spending in the United States on long-term care services and supports reached $310 billion, and Medicaid was the payer for 51 percent of those costs.4 Over half of Hispanics age 40 and older (53 percent) say they anticipate needing Medicaid for ongoing living assistance expenses. Expectations to rely on Medicaid were especially high among Hispanics with lower incomes or in poorer health. Nearly 7 in 10 Hispanics age 40 and older earning less than $50,000 a year expect to rely on Medicaid to pay for their ongoing living assistance needs compared to just 3 in 10 of those who earn $50,000 or more. Additionally, 7 in 10 Hispanics age 40 and older who describe their health as poor or fair expect to need Medicaid versus less than 4 in 10 of those who report excellent or very good health. The differences within these groups mirror those seen across the United States as a whole.
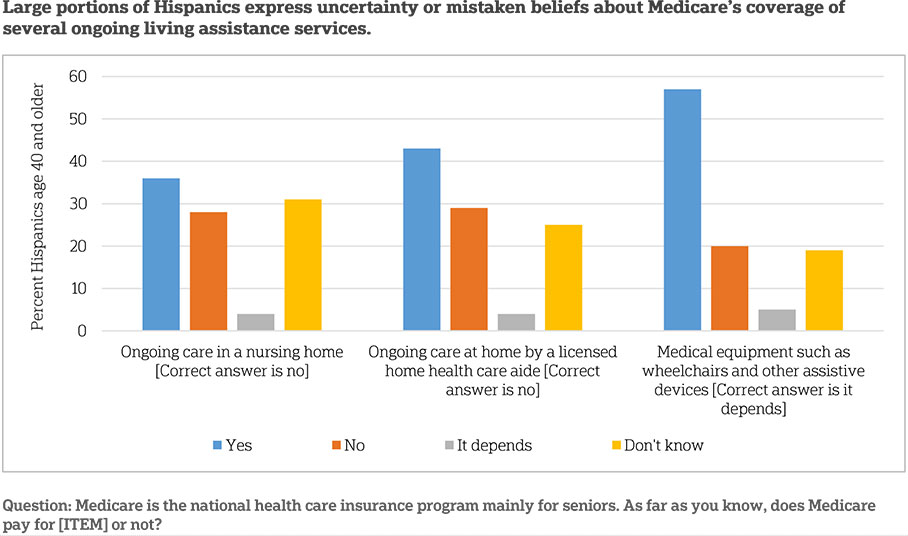
Misperceptions And Uncertainty About The Long-Term Care Services Covered By Private Insurance And Medicare Are Prevelant Among Hispanics.ꜛ
A typical private health insurance plan in the United States does not cover ongoing care in a nursing home, nor ongoing care at home by a licensed home health care aide. Only under certain circumstances would it cover medical equipment such as wheelchairs and other assistive devices. Sizeable portions of the Hispanic population age 40 and older either do not know if a typical private insurance plan covers these ongoing living assistance services older adults may need as they age, or they mistakenly believe that they are covered.
Sixteen percent of Hispanics age 40 and older mistakenly believe that a typical private health insurance plan covers ongoing care in a nursing home. An additional 21 percent do not know if this service is covered or not. Twenty-one percent mistakenly believe ongoing care at home by a licensed home health care aide is covered by a typical insurance plan, and an additional 16 percent do not know. Four in 10 incorrectly say that private insurance typically covers medical equipment such as wheelchairs and other assistive devices, with an additional 14 percent saying they do not know. These rates are no different from non-Hispanics age 40 and older. Older Hispanics earning less than $50,000 a year are more likely than those earning over $50,000 to correctly state that a typical private insurance plan does not cover care by an in-home health care aide (63 percent vs. 41 percent).
Like a typical private insurance plan, Medicare also does not cover many of the ongoing living assistance services that older adults may need as they age. It does not cover ongoing care in a nursing home, just intermittent stays, nor does it cover ongoing care at home by a licensed home health care aide. It will, however, cover assistive medical equipment when deemed by a physician as medically necessary.
Again, uncertainty around coverage of these services is high, as many Hispanics age 40 and older say they either expect Medicare to cover them or they do not know whether Medicare does or does not. Thirty-six percent of Hispanics age 40 and older mistakenly believe that Medicare will cover ongoing care in a nursing home, and an additional 31 percent do not know. Forty-three percent incorrectly say Medicare covers ongoing care at home by a licensed home health care aide, with an additional 25 percent saying they do not know if that service is covered or not. Fifty-seven percent say Medicare covers medical equipment such as wheelchairs or other assistive devices, while 20 percent say it does not, 19 percent say they do not know, and just 5 percent say it depends. These rates do not differ from non-Hispanics age 40 and older. Additionally, no further demographic differences were observed among Hispanics.
The number of Hispanics who say Medicare covers medical equipment (57 percent) has dropped since 2014, when 66 percent said this service was covered. This reflects a similar decline observed in the United States as a whole (67 percent in 2014, down to 62 percent in 2015).
Many Hispanics age 40 and older (38 percent) expect that their current health insurance would pay for long-term care services should they need them. This is no different than the rate among non-Hispanics (30 percent).
Continuing Trends And Other Comparisons Between Hispanics And Non-Hispanicsꜛ
Some of the attitudes and experiences reported by Hispanics age 40 and older in 2015 do not differ much from those reported in 2014. In some instances, rates have shifted or differ between groups, but unless specifically noted below, the following differences do not reach the commonly accepted standard of statistical significance.
- Policy support is high among Hispanics age 40 and older for several policies aimed to ease the financial burden of long-term care.
- Hispanics age 40 and older favor tax breaks to encourage savings (71 percent), tax breaks for purchasing insurance (67 percent), and portable employer-sponsored insurance (66 percent) at rates similar to non-Hispanics.
- Hispanics are more likely than non-Hispanics to support an individual requirement to purchase long-term care insurance (47 percent vs. 26 percent) and a government-administered long-term care insurance program (67 percent vs. 58 percent).
- These rates of policy support are similar to what has been observed in previous years.
- Fifty percent of Hispanics age 40 and older say they have any experience with long-term care (either providing, receiving, or financing), which is no different than the 51 percent of non-Hispanics. The rate among Hispanics was similar in 2014 (60 percent).
- Twelve percent of Hispanics are currently or have ever received ongoing living assistance, which is no different than the 10 percent of non-Hispanics. In 2014, 15 percent were currently receiving or have ever received ongoing living assistance.
- Similar to other Americans, Hispanics receiving care tend to have lower incomes.
- Forty-two percent of Hispanics are currently providing long-term care or have provided care in the past, which is no different than the rate among non-Hispanics (45 percent).
- Compared to 2014 (51 percent), the number of Hispanics age 40 and older who say they are currently or have ever provided care is statistically unchanged.
- Of Hispanics who expect to one day provide care, just 15 percent say they are very or extremely prepared, and 48 percent say they are not too or not prepared at all. These rates have not changed significantly since 2014. Compared to non-Hispanics, however, Hispanics are less likely to say they are very or extremely prepared (15 percent vs. 30 percent) and more likely to say they are not too or not prepared at all (48 percent vs. 16 percent).
- Hispanics age 40 and older are more likely than non-Hispanics to worry about being alone without friends or family around them (42 percent to 28 percent) and losing their memories or other mental abilities (57 percent to 46 percent). These rates are similar to those seen in past years.
About the Studyꜛ
Survey Methodology
This survey, funded by The SCAN Foundation, was conducted by The Associated Press-NORC Center for Public Affairs Research between the dates of April 7 and May 15, 2015. Staff from NORC at the University of Chicago, The Associated Press, and The SCAN Foundation collaborated on all aspects of the study.
This survey of the 50 states and the District of Columbia was conducted via telephone with 1,735 adults age 40 and older. In households with more than one adult age 40 and older, we used a process that randomly selected which eligible adult would be interviewed. The sample included 1,130 respondents on landlines and 605 respondents on cell phones. The sample also included an oversample of Californians age 40 years and older. The sample includes 460 residents of California age 40 and older. In addition, the sample included an oversample of Hispanics 40 years and older. The sample includes 419 Hispanics age 40 and older.
Respondents on landline phones were selected randomly within households. For households with two eligible adults age 40 and older, one respondent was selected randomly by the CATI system. For households with three adults or more age 40 and older, the respondent who most recently celebrated a birthday at the time of the call was selected. If the selected respondent was not available at the time of the call, interviewers were trained to set up a time to call back to speak with that respondent. To avoid an imbalance of older respondents on landline telephones, an additional screening criterion was added after we had surpassed the population proportion of adults age 65 and older (using ACS5 and NHIS6 estimates), such that landline households where all adults are age 65 and older were ineligible after this point. We continued to interview some adults age 65 and older after this point, on cell phones and in households reached via landline where at least one adult was under the age of 65. Cell phone respondents were offered a monetary incentive of $5 for participating, as compensation for telephone usage charges. Interviews were conducted in both English and Spanish, depending on respondent preference. All interviews were completed by professional interviewers who were carefully trained on the specific survey for this study.
The random digit dial sample, including the California oversample, was provided by a third-party vendor, Marketing Systems Group. The final response rate for the overall sample was 11 percent, based on the American Association of Public Opinion Research Response Rate 3 Method. Additionally, the final response rate for the California sample was 11 percent, and the final response rate for the Hispanic sample was 3 percent.
The sampling frame utilizes the standard dual telephone frames (landline and cell), with an oversample of numbers from the state of California, and a supplemental sample of both landline and cell numbers targeting households with Hispanic adults. The targeted sample was provided by Scientific Telephone Samples and was pulled from a number of different commercial consumer databases and demographic data. Sampling weights were calculated to adjust for sample design aspects (such as unequal probabilities of within household selection) and for nonresponse bias arising from differential response rates across various demographic groups. Poststratification variables included age, sex, race, region, education, and landline/cell phone use. The weighted data, which thus reflect the U.S. population, were used for all analyses. The overall margin of sampling error was +/- 3.2 percentage points, adjusted for design effect resulting from the complex sample design. The California sample’s margin of sampling error was +/- 5.4 percentage points, and the Hispanic sample’s margin of sampling was +/- 6.0 percentage points, both also adjusted for design effect resulting from the complex sample design.
All analyses were conducted using STATA (version 13), which allows for adjustment of standard errors for complex sample designs. All differences reported between subgroups of the U.S. population are at the 95 percent level of statistical significance, meaning that there is only a 5 percent (or less) probability that the observed differences could be attributed to chance variation in sampling. Additionally, bivariate differences between subgroups are only reported when they also remain robust in a multivariate model controlling for other demographic, political, and socioeconomic covariates. A comprehensive listing of all study questions, complete with tabulations of top-level results for each question, is available on The AP-NORC Center for Public Affairs Research long-term care website: www.longtermcarepoll.org.
Contributing Researchers
From NORC at the University of Chicago
Jennifer Benz
Dan Malato
Becky Reimer
Trevor Tompson
Emily Alvarez
David Sterrett
Jen Titus
Ivana Cvarkovic
Marjorie Connelly
Brian Kirchhoff
Wei Zeng
Jie Zhao
From the Associated Press
About The Associated Press-Norc Center For Public Affairs Research
- The Associated Press (AP) is the world’s essential news organization, bringing fast, unbiased news to all media platforms and formats.
- NORC at the University of Chicago is one of the oldest and most respected, independent research institutions in the world.
The two organizations have established The AP-NORC Center for Public Affairs Research to conduct, analyze, and distribute social science research in the public interest on newsworthy topics, and to use the power of journalism to tell the stories that research reveals.
The founding principles of The AP-NORC Center include a mandate to carefully preserve and protect the scientific integrity and objectivity of NORC and the journalistic independence of AP. All work conducted by the Center conforms to the highest levels of scientific integrity to prevent any real or perceived bias in the research. All of the work of the Center is subject to review by its advisory committee to help ensure it meets these standards. The Center will publicize the results of all studies and make all datasets and study documentation available to scholars and the public.
The complete topline data are available at www.longtermcarepoll.org.
Footnotesꜛ
1. U.S. Census Bureau. March 2015. Projections of the Size and Composition of the U.S. Population: 2014 to 2060. https://www.census.gov/content/dam/Census/library/publications/2015/demo/p25-1143.pdfꜛ
2. U.S. Census Bureau. December 12, 2012. Census Press Release. http://www.census.gov/newsroom/releases/archives/population/cb12-243.htmlꜛ
3. Home health care aide costs are based on 44 hours per week for 52 weeks, and nursing home care costs are based on private room care for 365 days per year. (Source: Genworth Financial Inc. 2015. Genworth 2015 Cost of Care Survey. https://www.genworth.com/corporate/about-genworth/industry-expertise/cost-of-care.htmlꜛ
4. Kaiser Commission on Medicaid and the Uninsured. 2015. Medicaid and Long-Term Services and Supports: A Primer. http://kff.org/medicaid/report/medicaid-and-long-term-services-and-supports-a-primer/ꜛ
5. United States Census Bureau. 2014. American Community Survey (ACS). http://www.census.gov/acs/www/data_documentation/2013_release/ꜛ
6. Centers for Disease Control and Prevention. 2014. National Health Interview Survey (NHIS). http://www.cdc.gov/nchs/nhis/nhis_2013_data_release.htmꜛ