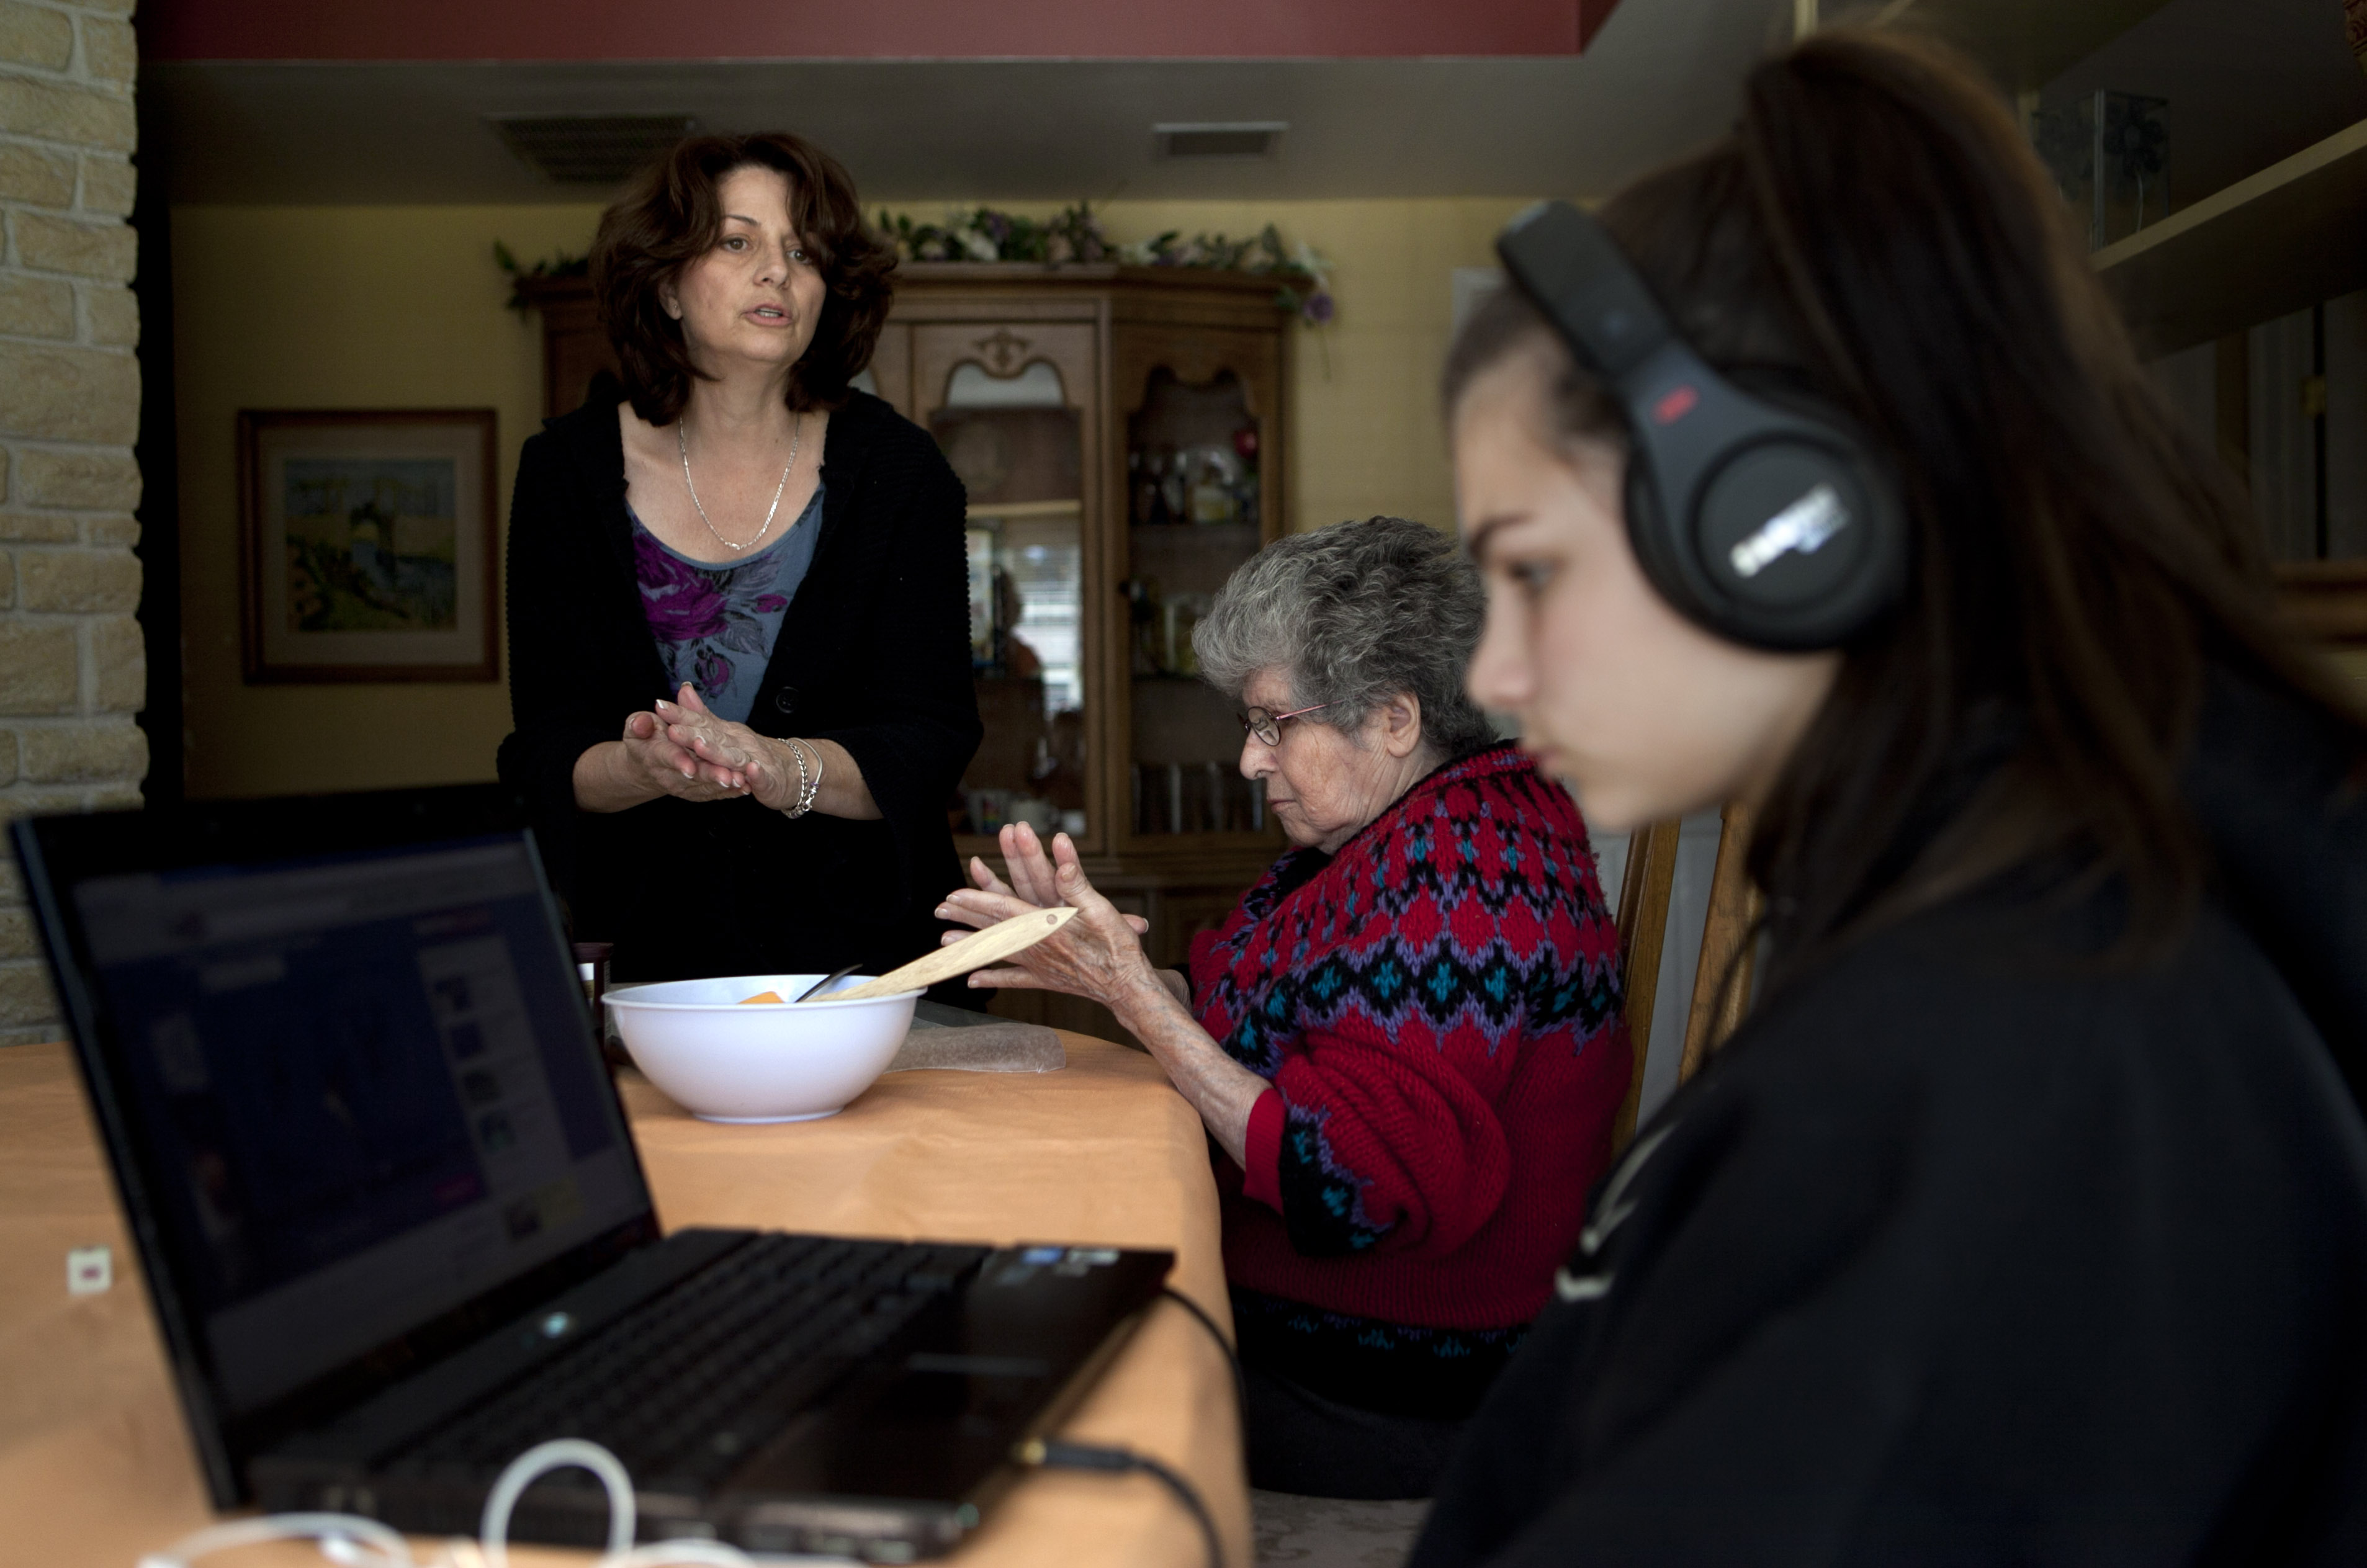
In this photo taken Dec. 22, 2011, Evelyn Volk, center, asks her 13-year-old daughter, Sofia, for help while making holiday treats with her mother Maria Koenig, who suffers from dementia, in the Woodland Hills section of Los Angeles. The sun was barely up when Volk, dressed in a bathrobe with toothbrush in hand, tossed a pile of clothes into the washing machine, the first of several loads of the day. She glanced at the wall clock that was deliberately set 10 minutes fast. Time to rustle her two teenage kids out of bed and check on her elderly mother who remained fast asleep. These bookend family responsibilities land Volk squarely in the "sandwich generation" _ pressed between dual roles of supporting aging parents while rearing children. (AP Photo/Jae C. Hong)
In the next 25 years, the U.S. population is expected to include 82 million Americans over the age of 65,1 the vast majority of whom will require some type of long-term care as they age.2 Policymakers, health care systems, and families are all facing the question of how to provide high-quality long-term care and how to finance that care for this country’s growing senior population.
To help address this policy issue, research conducted by The Associated Press-NORC Center for Public Affairs Research examines awareness of older Americans’ understanding of the long-term care system, their perceptions and misperceptions regarding the likelihood of needing long-term care services and the cost of those services, and their attitudes and behaviors regarding planning for long-term care.
Findings from this third survey in a series of studies of Americans age 40 and older show that most still do not feel prepared in terms of planning or financing long-term care for themselves or a loved one. Americans who find themselves providing long-term care while also supporting a child are especially likely to feel concerned about many aspects of aging. Focusing on the experiences of those currently receiving and providing care, the survey finds some indications that many people have access to personalized care and coordinated care, though many report a lack of good communication across multiple providers. The data also show some improvements in understanding of how long-term care is financed in the United States, though widespread misperceptions remain.
In 2013, The AP-NORC Center conducted a unique national survey investigating experiences and attitudes regarding long-term care.3 The survey revealed that a majority of American adults age 40 and older held several misperceptions about the extent of the long-term care services that they are likely to need in the future, and the cost of those services. Few older Americans had done substantial planning or saving for their future needs, and less than half had even talked about the topic with their families. A majority supported a variety of policy changes that would help in the financing of long-term care.
A second study was completed a year later4 and included new goals of describing who is receiving and providing long-term care, how those who provide care to family and close friends reflect on their caregiving experiences, and how Americans view several policy options that might improve the quality of long-term care. Many issues were tracked from 2013 to 2014, with attitudes on a majority of items remaining stable over that time.
This third survey, conducted in the spring of 2015, explores new issues, including person-centered care experiences, the role of private health insurance plans in financing long-term care, and the special challenges faced by those who provide ongoing living assistance to elderly loved ones while also providing financial support to children. At the same time, the survey continues to track long-term care attitudes and planning behaviors.
The need for long-term care services is expected to dramatically increase over the coming decades, as the senior population is expected to nearly double. In 2000, Americans age 65 or older made up only 12 percent of the national population, but by 2040, it is expected that seniors will comprise about 22 percent. With this expanding need comes a demand for ways to maintain high-quality services and to make financing such care manageable for families and governments alike. To continue contributing new data to inform policymakers and the public about Americans’ understanding of and experiences with long-term care in this country, The AP-NORC Center, with funding from The SCAN Foundation, conducted 1,735 telephone interviews with a nationally representative sample of Americans age 40 and older.
Key findings from this study are described below:
- A majority of those with experience either receiving or providing ongoing living assistance report that this care includes at least one component of “person-centered care.” Most of those who are experiencing these features feel that they have improved the quality of care.
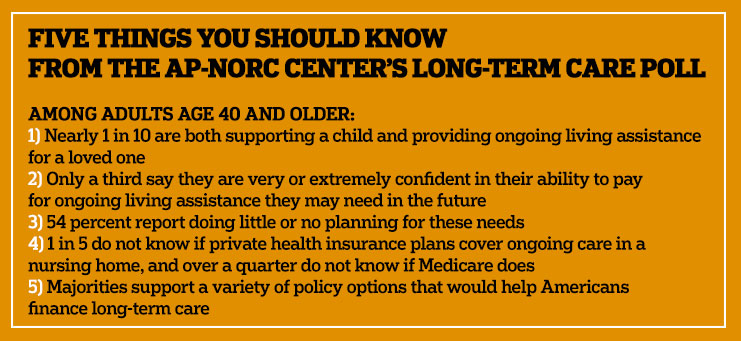
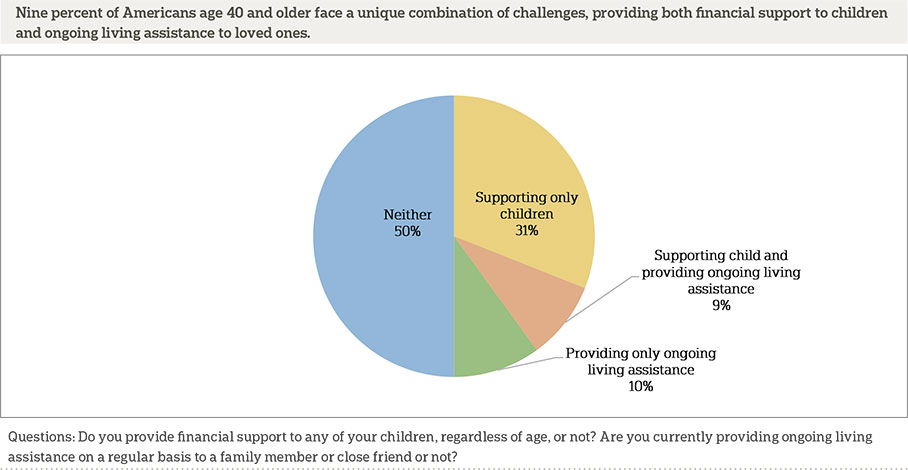
- Nine percent of all Americans age 40 and older and 12 percent of those age 40 to 54 fall into the “sandwich generation,” which includes individuals of any age who face a challenging combination of responsibilities supporting the generations before and after themselves, providing both financial support for their children and ongoing living assistance to other loved ones. This segment of the population is more deeply concerned about several aspects of aging such as paying for future care and leaving debts to family, although they are no more likely than others to plan for future needs.
- Consistent with previous years’ findings, many older Americans continue to lack confidence in their ability to pay the costs of ongoing living assistance, with only a third saying they are very or extremely confident, and only a third saying that they have set aside money for care.
- Misperceptions about the types of coverage Medicare provides for ongoing living assistance services have declined since 2014, but still exist. And more than 1 in 4 Americans age 40 and older are unsure whether Medicare pays for ongoing living assistance services like nursing homes and home health aides. Modest minorities of older Americans also overestimate private health insurance coverage of these services. A majority also continues to hold misperceptions about the role of Medicaid in financing long-term care in this country.
- Since 2013, the proportion of older Americans who believe they will eventually need ongoing living assistance has dropped from 65 percent to 53 percent but remains a majority. The largest decline in perceived need is among the youngest segment of this population.
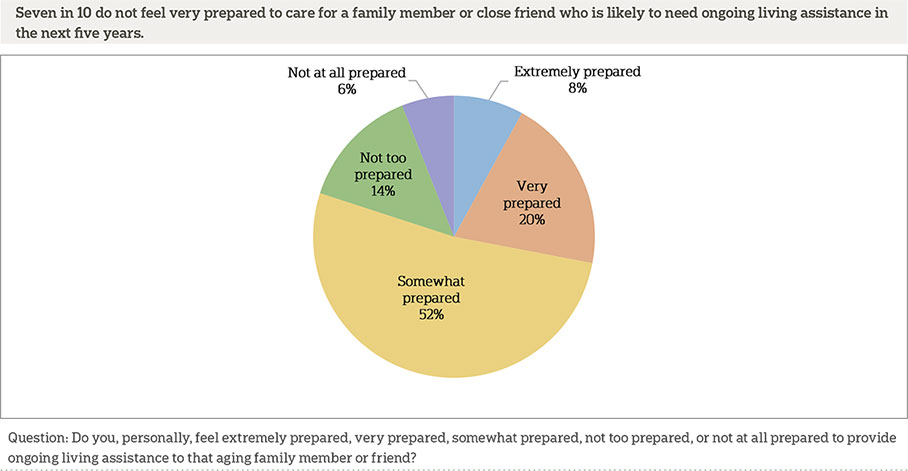
- Compared to two years ago, fewer older Americans believe that a family member or close friend will need ongoing living assistance within the next five years. Those who do anticipate this need remain uneasy, with 7 out of 10 reporting that they do not feel very prepared to provide care.
- Reports of general planning for ongoing living assistance needs have increased over the past year, but a majority (54 percent) still report that they have done little or no planning, and the number of Americans age 40 and older who have taken specific actions to plan for long-term care remains unchanged.
- Majorities support a variety of policy proposals to help finance care, like a government-administered long-term care plan similar to Medicare, while the already low support for a requirement to purchase long-term care insurance has decreased slightly over the past year.
Additional information, including the survey’s complete topline findings, can be found on The AP-NORC Center’s long-term care project website at www.longtermcarepoll.org.
Nearly Half Of Americans Age 40 And Older Have Experience Providing Ongoing Living Assistance, And Many Say It Is Likely They Will Need To Provide Care For A Family Member Or Close Friend In The Future.ꜛ
Substantial numbers of Americans report having experience providing ongoing living assistance.5 Forty-five percent of Americans age 40 and older say they have at some point provided long-term care for a family member or close friend, which is down slightly from 53 percent in 2013 and 2014. Among those with experience providing care for a family member or friend, 19 percent report they are currently providing assistance, which nearly matches the 2014 rate of 20 percent.
Of those with experience in providing long-term care, 57 percent are female and 65 percent have household incomes of less than $75,000 a year. The average age of those who report providing such care is 59. Blacks are more likely to have experience providing ongoing living assistance for a family member or close friend (54 percent) than both whites (42 percent) and Hispanics (42 percent).
Six percent of adults age 40 and older are currently paying someone to provide in-home care for themselves, a family member, or a friend. College graduates are more likely to pay for someone to provide such in-home care (8 percent) than those without a college degree (5 percent).
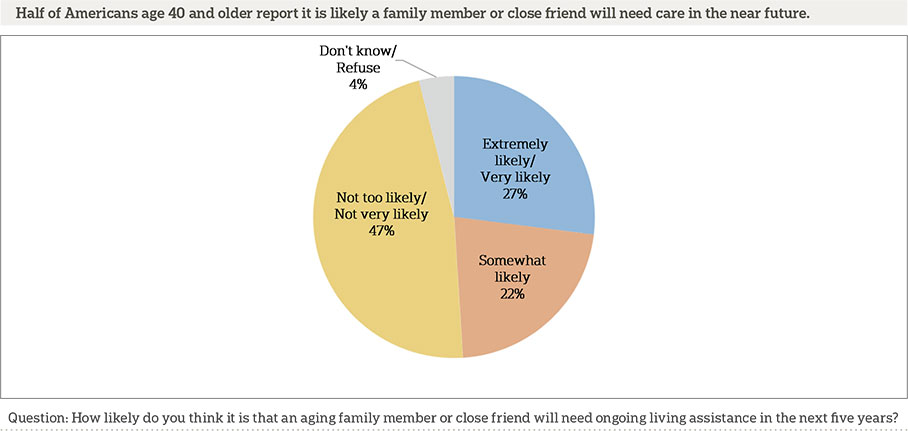
Many adults age 40 and older expect a family member or close friend will soon need long-term care. About half of adults in this age group report it is likely that an aging family member or close friend will need ongoing living assistance in the next five years, including about 1 in 4 who say it is very or extremely likely.
Self-reported health relates to beliefs about the likelihood of a family member or friend needing assistance in the future. Americans age 40 and older who report having poor or fair health are more likely to believe a family member or friend will need future care (60 percent) than those who say their health is good, very good, or excellent (46 percent).
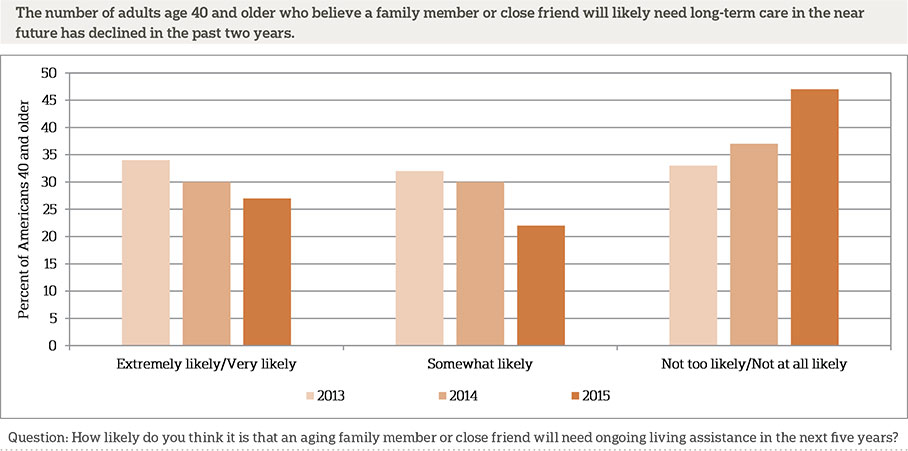
Similar to the trend for expectations for personally needing long-term care, over the past two years there has been a decline in the number of Americans age 40 and older who expect a loved one will need ongoing living assistance in the next five years. In 2013, two-thirds of those 40 and older reported that it was at least somewhat likely that a family member or friend would need future care within the next five years. This rate dropped to 60 percent in 2014 and to 49 percent this year.
Among those who say a loved one will need care soon, 44 percent think they will be at least partially responsible for providing the assistance, while half report someone else will be responsible.
Many of those who expect to be responsible for the care of a family member or close friend in the near future do not feel very well prepared, which is consistent with findings from last year. Nineteen percent of these potential caregivers say they are not too prepared or not at all prepared, 52 percent say somewhat prepared, and 28 percent say they are very or extremely prepared.
About 1 In 10 Americans Age 40 And Older Have Received Ongoing Living Assistance.ꜛ
Although few adults age 40 and older have already received ongoing living assistance, a majority of this age group expects to need such care in the future. One in 10 Americans age 40 and older report having received ongoing living assistance, including 7 percent who are currently receiving such care. These numbers are consistent with the findings from previous years.
Self-reported health is associated with the likelihood of having received ongoing living assistance. Twenty-three percent of adults 40 and older who report their health is fair or poor say they have received long-term care compared with 6 percent who say their health is good, very good, or excellent.
Among those receiving ongoing living assistance, most receive it at home (82 percent) while less than 1 in 10 report receiving it at a friend or family member’s home (8 percent), a nursing home (6 percent),6 or a senior community (1 percent). When asked about different sources of ongoing living assistance, 50 percent report having received help from a family member, 48 percent from a professional home health care aide, and 23 percent from a friend.
Those Currently Experiencing Long-Term Care Feel Person-Centered Care Practices Have Improved Treatment.ꜛ
Recent years have seen an increasing focus on “person-centered care,” an approach to health care and supportive services that allows individuals to take control of their own care by specifying preferences and outlining goals that will improve their quality of life. There is no single approach to providing person-centered care for individuals receiving long-term care services, meaning that health care providers and government agencies that are working to adapt their practices are doing so in a variety of ways.
The 2014 poll found widespread support for integrating several person-centered care proposals into long-term care. These included ensuring that all care is focused on the person’s quality of life as well as length of life, taking personal goals and preferences into account during all aspects of ongoing living assistance, designating a caregiver on the medical chart who must be included in all discussions about care, and assigning a single case manager who can coordinate all aspects of the person’s care. The 2015 poll went beyond asking about support for these proposals and included questions assessing actual experiences with person-centered care as part of ongoing living assistance, for both recipients and providers of care.
One challenge of providing care to older patients is that individuals’ needs for services may increase as they age, which often means receiving care from multiple providers. A central tenant of person-centered care is the provision of coordinated care across multiple health care providers. The 2015 survey reveals that a quarter of Americans age 40 and older are currently either receiving or providing long-term care, and, among this group, 65 percent say they are working with two or more health care providers.
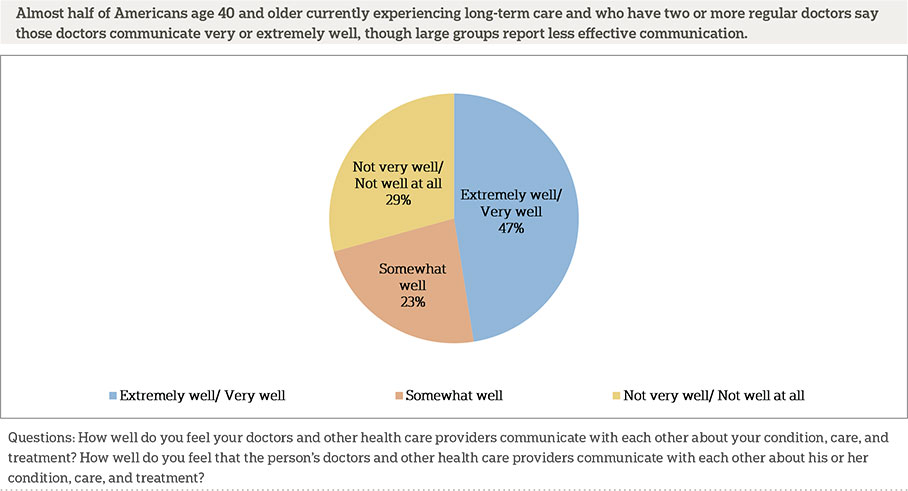
Those who are currently working with two or more doctors as part of their own long-term care or the care of loved ones have mixed feelings about whether or not these doctors do a good job of communicating with one another about patient treatment, care, and condition. Forty-seven percent say their doctors communicate with each other extremely or very well as opposed to 29 percent who say they communicate not very well or not well at all. Twenty-three percent say their doctors communicate somewhat well.
This survey asked about two other specific aspects of person-centered care: having a single care manager who serves as a point of contact and can coordinate all aspects of care, and having an individualized care plan designed to take into account the patient’s personal goals and preferences. Many of those currently experiencing long-term care either as a recipient or provider say the doctors providing care engage in these practices. Nearly 8 in 10 (79 percent) say that the care involves one of these person-centered care measures, and 46 percent say it includes both.
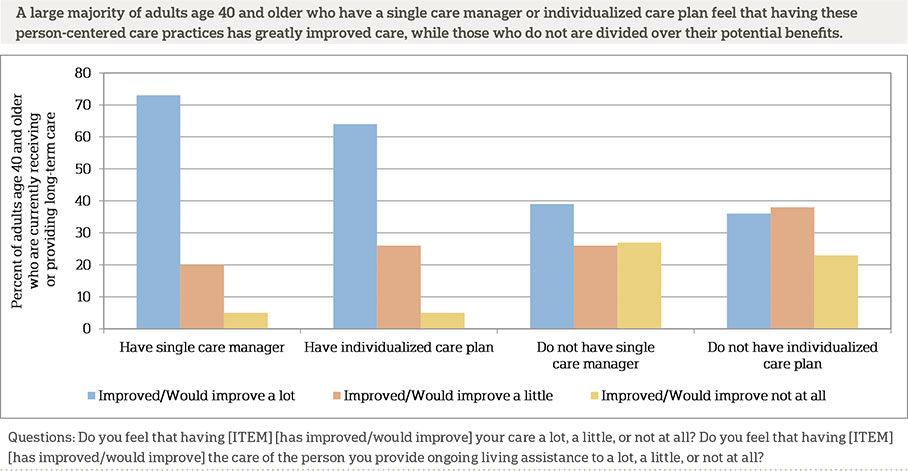
Two-thirds (67 percent) of those currently experiencing long-term care either as a recipient or provider say a single care manager serves as a point of contact for coordinating all aspects of care among their doctors. Of those, more than 7 in 10 say they feel this practice has improved care a lot. An additional 2 in 10 say it has improved care a little, while less than 1 in 10 say it has not improved their care. Of those who say they do not have a single care manager who serves as a point of contact coordinating all aspects of care, 39 percent say it would improve care a lot, 26 percent say a little, and 27 percent say it would not improve care at all.
Nearly 6 in 10 of those currently experiencing long-term care say that care involves an individualized care plan designed to take into account personal goals and preferences. Of those, more than 6 in 10 say it has improved their care a lot, and 26 percent say it has improved their care a little. Just 5 percent say it has not improved their care at all. Among those who say their care does not involve an individualized care plan, 37 percent say having one would improve care a lot, 38 percent say it would improve care a little, and 23 percent say it would not improve care at all.
Together, these results about person-centered care features suggest that while these features are valued by those who have experienced them, their potential advantages may not be well understood by those who have not. The lower level of perceived benefit for these measures by those who have not personally experienced them could make their widespread adoption more challenging.
An Important Minority Of The Population Fits Into The “Sandwich Generation”—Providing Care To Both A Child And A Parent Or Another Relative—And They Have More Concerns About Aging Than Others.ꜛ
Americans age 40 and older have a diverse set of family obligations when it comes to financial support and ongoing living assistance. Substantial numbers of Americans age 40 and older are supporting a family, and many live in multigenerational households. A small but important group are faced with the challenge of caring for family members in both younger and older generations.
Americans in the so-called “sandwich generation” face dual challenges of financially supporting children and providing ongoing living assistance to family members or friends. Four in 10 adults age 40 and older say that they are providing financial support to at least one child. Nineteen percent are currently providing ongoing living assistance to a family member or close friend. Half of older Americans are not providing either of these types of support, while 9 percent fall into both of these categories. Within the youngest group surveyed (age 40 to 54), the size of this “sandwich” group rises to 12 percent. An additional 8 percent of all adults age 40 and older may join this group in the near future, as they report that they are currently providing financial support to a child and that they expect to be personally providing ongoing living assistance to a family member or close friend within the next five years.
Support for adult children plays an important role here. A majority (56 percent) of parents who are providing support have children who are minors, but many others (44 percent) are supporting children who are age 18 or older. Parents in the sandwich generation are even more likely to be supporting adult children. Less than half (48 percent) of these currently “sandwiched” parents have children who are under age 18, while a narrow majority (52 percent) have only adult children. Nearly a third (29 percent) of these sandwiched parents have adult children living at home.
Younger adults within the age 40 and older group are more likely to provide financial support to children and to be members of the sandwich generation than are older adults. Over three-quarters (76 percent) of those between the ages of 40 and 54 provide financial support for children, while only 45 percent of those 55-64, and 24 percent of those 65 and older do so. Sixteen percent of parents age 40 to 54 are sandwiched, compared with 12 percent of those 55-64, and 6 percent of those 65 and older.
Blacks age 40 and older are more likely than whites to report these types of family obligations. Blacks are more likely than whites to report providing financial support to children (67 percent vs. 48 percent) and are more likely to fall within the sandwich generation (20 percent vs. 6 percent).
It seems plausible that the sandwich generation group might differ from other Americans with respect to their attitudes and planning behaviors about long-term care. On the one hand, this group might be so busy attending to the needs of their family members that they have fewer resources to devote to planning and saving for their own long-term care needs. On the other hand, the stresses of their special circumstances might motivate them to be especially active in planning and saving. We find that this group is not substantially different from other Americans regarding planning and saving for their own needs, or in their confidence about their ability to pay for those needs in the future.
However, they are more likely to be deeply concerned about several aspects of aging than other adults in their age group. Adults age 40 and older who fall within the sandwich generation are more likely than others to say they have quite a bit or a great deal of concern about being able to pay for any care or help they might need as they grow older (54 percent vs. 36 percent), leaving debts to family (44 percent vs. 28 percent), having to leave their homes and move into nursing homes (50 percent vs. 38 percent), and being alone without family and friends (36 percent vs. 29 percent).
Americans Lack Confidence In Their Own Financial Prepardness For Ongoing Living Assistance Needs, As Well As Accurate Understanding Of Coverage Of Long-Term Care Services.ꜛ
Americans age 40 and older continue to lack confidence in their ability to pay for any ongoing care they may need as they get older. These concerns are warranted as this care is expensive, with median costs of $45,760 per year for ongoing care at home from a home health care aide, and $91,250 per year for nursing home care.7 Just 32 percent say they are very or extremely confident they will have the financial resources to pay for ongoing living assistance, 35 percent are somewhat confident, and 30 percent are not very or not at all confident, roughly equivalent to the 2014 rates.
Adults age 40-54 and those age 55-64 express lower levels of confidence in their financial preparedness than do adults age 65 or older (26 percent and 33 percent vs. 40 percent). Those who rate their personal health as excellent or very good express more confidence in their ability to pay for ongoing living assistance than those who rate their health as good or fair or poor (41 percent vs. 29 percent and 22 percent). And adults with household incomes greater than $50,000 are more likely than those with incomes of less than $50,000 to say they are confident in their financial preparedness for ongoing living assistance needs (40 percent vs. 24 percent).
The 2013 and 2014 polls examined understanding of the long-term care services that Medicare covers. This year’s survey tracked these questions and added similar questions to assess knowledge about coverage from a typical private health insurance plan.
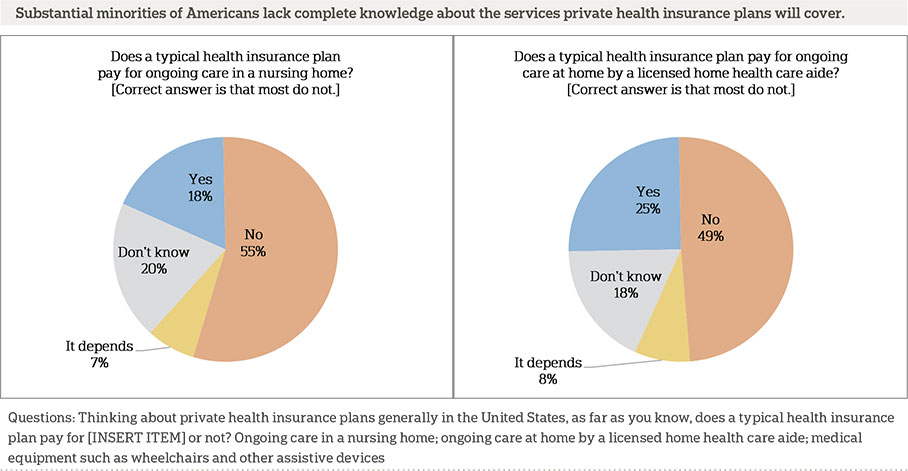
Most health plans in the United States do not cover long-term services such as ongoing care in a nursing home or ongoing care at home by a licensed home health care aide. Eighteen percent of Americans age 40 and older believe that health plans will generally pay for ongoing nursing home care, and 25 percent believe that health insurance plans will generally pay for ongoing care at home. In addition, roughly 1 in 5 Americans age 40 and older say they are unsure of the typical insurance coverage for these types of long-term care services (20 percent and 18 percent, respectively).
Private health insurance plans in the United States typically cover medical equipment such as wheelchairs and other assistive devices, but this coverage depends on documented medical need for the device. Forty-seven percent of Americans age 40 and older believe health plans will generally pay for this type of equipment.
Among those Americans age 40 and older who are insured, 31 percent say their current health plan pays for ongoing living assistance services should they be needed, 38 percent say it will not, and 30 percent do not know. Those with private insurance (25 percent) are less likely than those with Medicare (38 percent) or those with Medicaid (43 percent) to say that current health insurance will cover ongoing living assistance services.
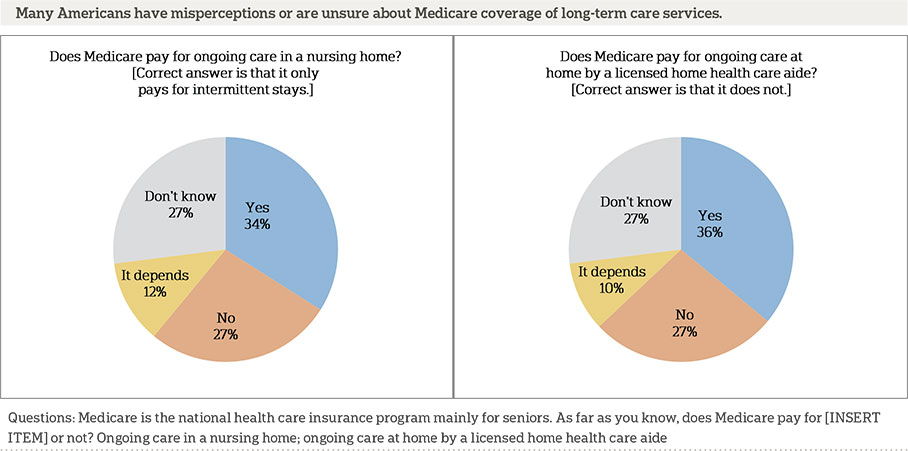
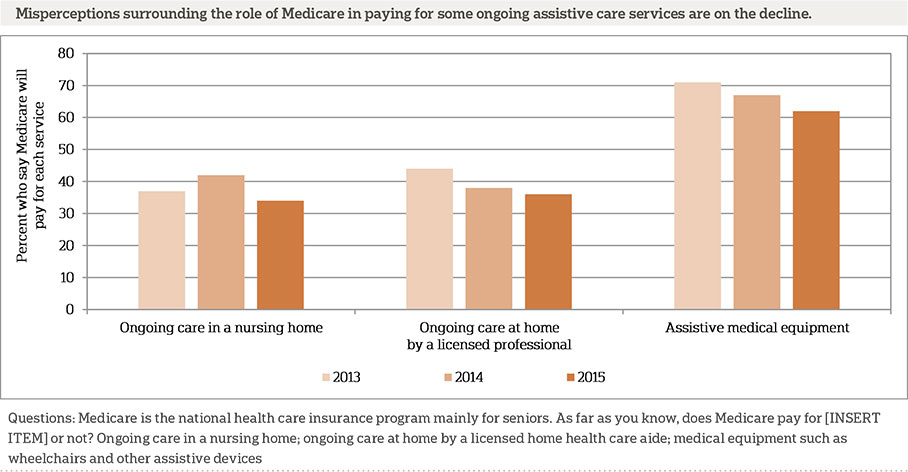
Over a third of older Americans have misconceptions about the coverage of these services provided by Medicare, and many others are uncertain. In 2014, when asked whether Medicare pays for ongoing care in a nursing home, 42 percent of Americans age 40 and older said they believed that it does, and 21 percent said they didn’t know. Today, just 34 percent say Medicare covers this type of care, and 27 percent are unsure. Medicare pays for intermittent stays at a nursing facility but not long-term stays.
In addition, Medicare does not generally pay for ongoing care at home by a licensed home health care aide, yet 36 percent of Americans age 40 and older believe that it does, and 27 percent say they don’t know. This finding is similar to the 2014 study, when 38 percent said Medicare will pay for home health care, and 25 percent were unsure.
Fewer Americans today than in 2014 believe that Medicare covers medical equipment such as wheelchairs and other assistive devices (67 percent and 62 percent, respectively). Medicare will cover assistive devices when prescribed as medically necessary by a health care professional.
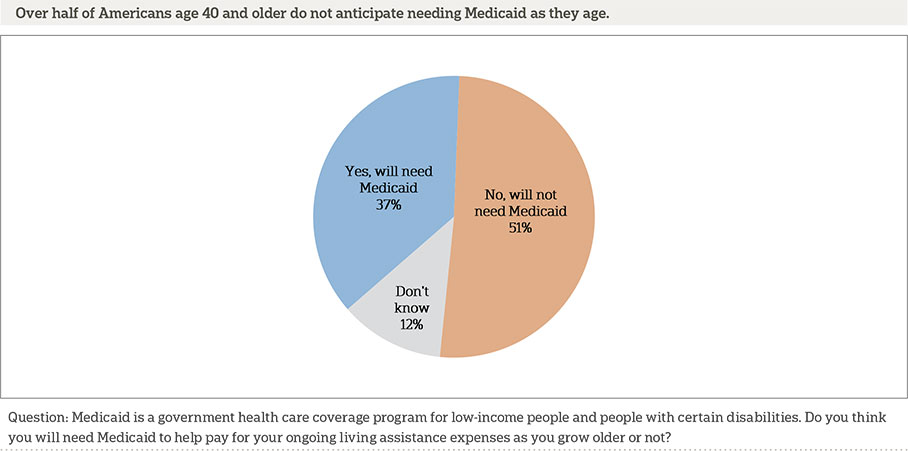
Medicaid, a health care coverage program for low-income people and those with disabilities funded jointly by both the state and federal governments, is the single largest payer of long-term care services in the United States. In 2013, the national total for long-term care services and supports cost was $310 billion, and Medicaid was the payer for 51 percent of those costs.8 Yet 51 percent of Americans age 40 and older do not expect that they will need Medicaid to help pay for their ongoing living assistance expenses as they age, roughly equivalent to the 2014 rate of 53 percent.
As was revealed in the 2014 study, several demographic differences emerge in terms of anticipating the need for Medicaid benefits. African Americans are twice as likely as whites to say they think they will need Medicaid to help pay for long-term care services (60 percent vs. 30 percent). Adults age 40-54 and 55-64 are about twice as likely as adults age 65 or older (44 percent and 41 percent vs. 23 percent) to expect that they will need Medicaid. Those with incomes of under $50,000 are more than twice as likely to say they will need Medicaid to help pay for ongoing living assistance than those with incomes of more than $50,000 (54 percent vs. 25 percent).
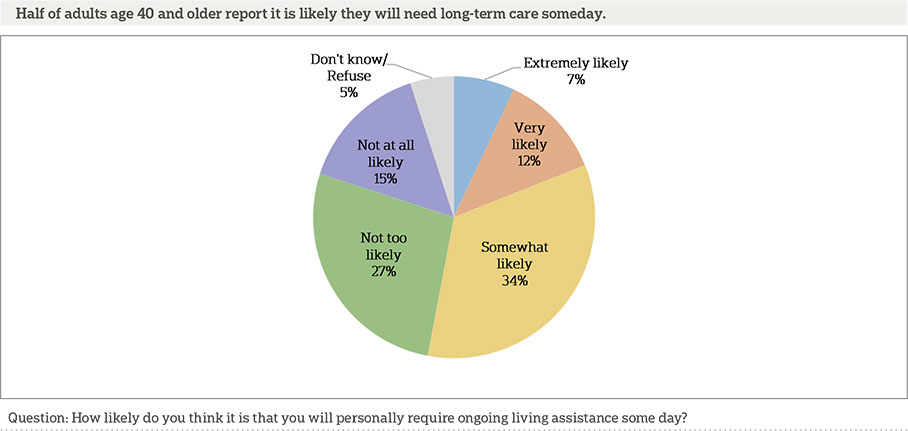
More Than Half Of Older Americans Believe It Is Likely They Will Need Ongoing Living Assistance Someday.ꜛ
Many Americans age 40 and older who are not currently receiving ongoing living assistance expect to need it in the future. Slightly more than half say it is at least somewhat likely (53 percent) that they will require ongoing living assistance one day, including about 1 in 5 adults age 40 and older in this age group who believe it is very or extremely likely (19 percent).
Education and self-reported health are associated with beliefs about the likelihood of needing long-term care in the future. Fifty-eight percent of those with a college degree report it is likely they will need assistance in the future compared with 50 percent of those without a college degree. Sixty-three percent of adults who rate their health as fair or poor say it is likely they will need assistance compared with 50 percent of those who rate their health as good, very good, or excellent.
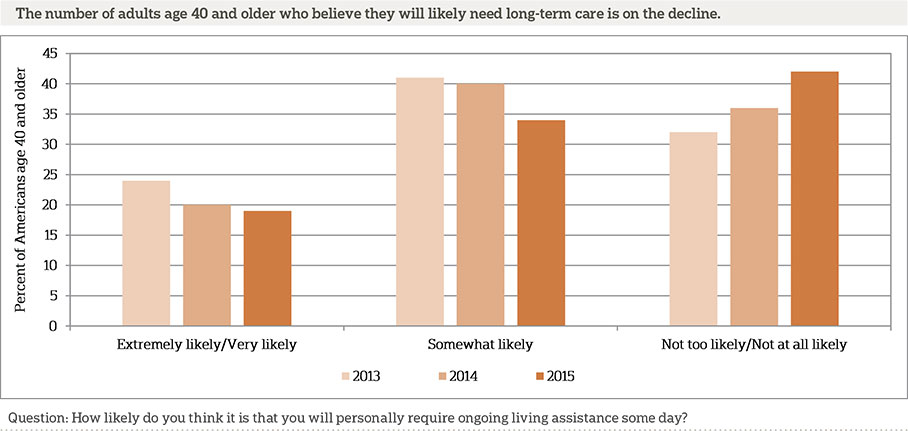
Over the past two years, there has been a steady decline in the number of adults age 40 and older who believe it is likely they will need ongoing living assistance in the future. In 2013, the percentage of adults age 40 and older who reported that it is at least somewhat likely that they will need care was 65 percent. This rate dropped to 60 percent in 2014 and to 53 percent in 2015.
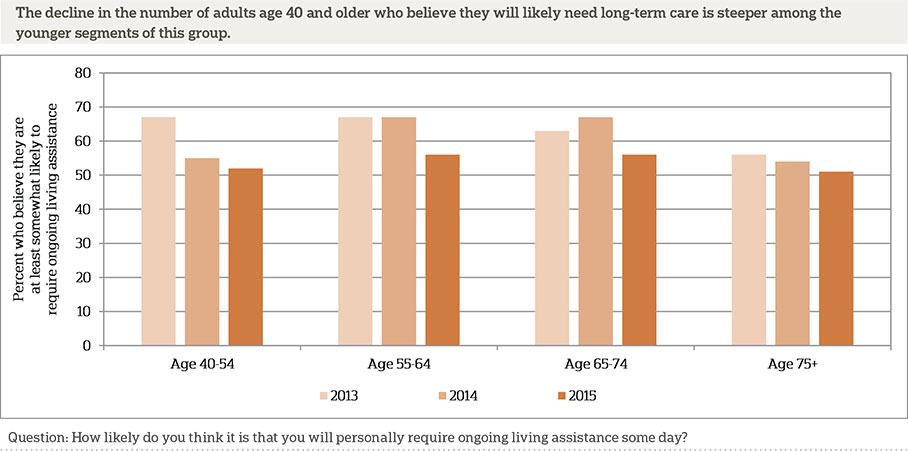
This change is most pronounced among the younger segments of the group age 40 and older. Those in the youngest group of 40- to 54-year olds showed a slightly steeper decline than older age groups, dropping from 67 percent in 2013 to 55 percent in 2014 and to 52 percent in 2015. We investigated this decline for differences on other demographic variables such as gender, race/ethnicity, income, and education, as well as self-reported health and insurance status, but none of these appear to be related to the decline.
There are a number of potential reasons for this decline in expectation about the need for care. One potential explanation is a general increase in optimism and future outlook due to improvements in the economy since this poll started in 2013. This improved outlook could lead people to feel more optimistic about their own long-term health situation. Another potential cause is a decrease in media coverage about health care discussions since earlier rounds of this poll. This declining public focus on health care issues may mean people are not attending to or thinking as much about their long-term health needs. Another potential contributor to this effect is a slow generational shift in the group of Americans who are age 40 and older for each of these polls, including fewer baby boomers and more Gen Xers. If the younger groups have parents who are living progressively longer, this could impact how they anticipate their own needs for future care. These hypotheses are speculations that we cannot substantiate with data from this survey.
Although Americans Are Anxious About Having To Rely On Others As They Age, Few Are Concerned That They Are Not Planning Enough For Long-Term Care.ꜛ
When asked about a variety of challenges related to aging, sizable minorities of Americans age 40 and older are deeply concerned about these issues. Nearly half (47 percent) say they have quite a bit or a great deal of concern about losing their independence and having to rely on others, and the same number have this level of concern about losing their memory or other mental abilities. Fewer are as concerned about having to leave home and moving to a nursing home (39 percent), paying for care as they age (38 percent), and being a burden on family (36 percent). Only a third or less are as concerned about not planning enough for care they might need (33 percent), leaving debts to family (29 percent), and being alone without family or friends (29 percent).
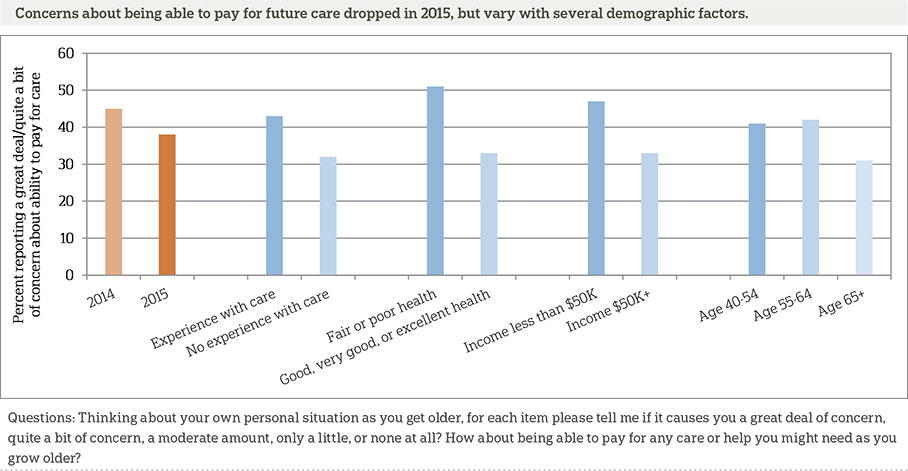
Most of these levels of concern have remained stable over the past year. However, concerns about financial preparation have decreased. Thirty-eight percent report feeling quite a bit or a great deal of concern about their ability to pay for care as they age, compared to 45 percent in 2014 and 44 percent in 2013.
Experience with ongoing living assistance is associated with higher levels of concern about some of the challenges of growing older. Americans age 40 and older with such experience are more likely than others to express quite a bit or a great deal of concern about losing memory or other mental abilities (52 percent vs. 41 percent), losing their independence and having to rely on others (51 percent vs. 42 percent), being able to pay for any care or help they may need (43 percent vs. 32 percent), and being alone without family or friends (33 percent vs. 26 percent). Those with long-term care experience are less likely to say they lack concern about not planning enough for the care they might need as they grow older (36 percent vs. 46 percent) and having to move into a nursing home (40 percent vs. 47 percent) compared to those who do not have experience with ongoing living assistance.
When it comes to worrying about financial challenges related to aging, levels of concern are elevated among lower-income Americans age 40 and older compared to those from higher-earning households. Those who have a household income of less than $50,000 are more likely to report worrying quite a bit or a great deal about leaving debts to their family than those with an income of $50,000 or greater (50 percent vs. 38 percent). Those from households making less than $50,000 are also more likely to worry quite a bit or a great deal about being able to pay for care compared to those from higher-earning households (47 percent vs. 33 percent).
Being in poor health is associated with increased concerns about aging among Americans age 40 and older. More than half (51 percent) of those who rate their health as fair or poor have quite a bit or a great deal of concern about being able to pay for care compared to only a third of those who rate themselves as being in good, very good, or excellent health (33 percent). Americans age 40 and older who rate themselves as being in fair or poor health are also more likely than those who rate themselves as being in good, very good, or excellent health to express quite a bit or a great deal of concern about not planning enough for care they might need in the future (47 percent vs. 29 percent), leaving debts to their family (43 percent vs. 25 percent), and being alone without family or friends (41 percent vs. 25 percent).
Interestingly, as Americans 40 and older age, they are less likely to be as concerned about some potential difficulties associated with aging. Those age 65 or older are significantly less likely to be concerned quite a bit or a great deal about being able to pay for care, leaving debts to family, and not planning enough for care they might need as they age, compared to those age 40 to 64.
Most Americans Age 40 And Older Report Doing Little Or No Long-Term Care Planning.ꜛ
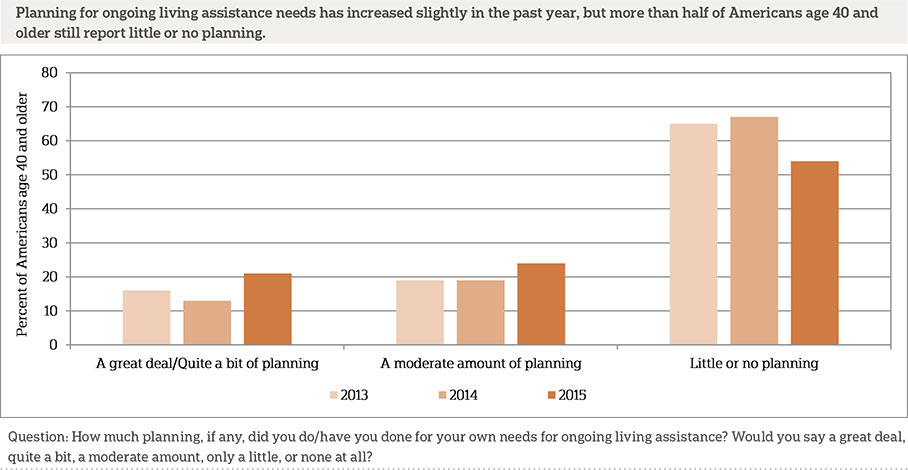
As in previous years, concerns about aging issues are high, but more than half of Americans age 40 and older report doing little or no planning at all for their own ongoing living assistance needs. The proportions of Americans reporting that they have done at least a moderate amount of planning increased slightly since last year, although there were no substantial changes on the questions asking about specific planning actions.
The number of older Americans who report doing a great deal or quite a bit of planning increased from 13 percent to 21 percent between 2014 and 2015, while those reporting a moderate amount of planning increased from 19 percent to 24 percent. It follows, then, that fewer Americans age 40 and older reported doing little or no planning compared to last year’s findings. Two-thirds of Americans age 40 and older (67 percent) reported doing little or no planning for their own care needs in 2014 compared to just over half (54 percent) reporting this in 2015.
The likelihood of planning for ongoing living assistance increases with a number of factors, including being older, higher income, having more education, better health, and having experience with ongoing living assistance. A quarter of Americans 65 or older report doing a great deal or quite a bit of planning compared to 18 percent of 40- to 54-year-olds and 22 percent of 55- to 64-year-olds. This rate for 40- to 54-year-olds represents a substantial increase from last year; it has nearly doubled from 10 percent in 2014.
Those in households earning $50,000 a year or more are more than twice as likely as those earning less to report planning for their own care (28 percent vs. 13 percent). Even controlling for income, there are also differences in rates of planning based on education. Over 6 in 10 (63 percent) of those with only a high school degree or less education report doing little or no planning for their own care needs compared to less than half (47 percent) of those with at least a technical/trade school degree or some college.
Being healthy is also a predictor of planning for ongoing living assistance needs among Americans age 40 and older. Compared to those who rate their overall health as fair or poor, those who rate their overall health as excellent, very good, or good are more likely to report doing a great deal or quite a bit of planning (23 percent vs. 16 percent) or a moderate amount of planning for their own care needs (26 percent vs. 18 percent).
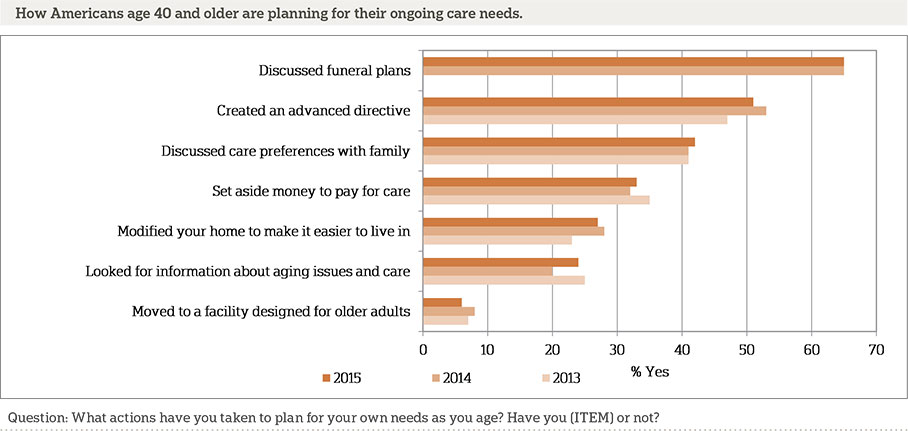
While there have been slight increases over the past year in the number of Americans who report planning generally, when it comes to taking specific planning actions, there are no increases in planning in 2015, and more Americans age 40 and older report taking actions to plan for their own death than actions to address possible future needs while they are living.
Nearly two-thirds (65 percent) have discussed preferences for their funeral arrangements with someone they trust. About half (51 percent) also report that they have created an advanced directive or living will. By comparison, a minority (42 percent) have discussed their preferences for ongoing living assistance. Even fewer have set aside money to pay for care (33 percent), looked for information on long-term care insurance (28 percent), modified their home to make it easier to live in as they age (27 percent), looked for information about aging issues and ongoing living assistance (24 percent), or made plans to move or moved to a living facility designed for older adults (6 percent).
Older age groups are more likely to report taking many of these planning actions. Only a quarter of those age 40 to 54 report setting aside money to pay for care compared to 34 percent of those age 55 to 64 and 43 percent of those age 65 or older. Similarly, a minority of those age 40 to 54 (37 percent) have created an advanced directive or living will, compared to half of those age 55 to 64 and nearly three quarters of those age 65 or older (71 percent). Looking for information about aging issues and ongoing living assistance, making plans to move or moving to a living facility designed for older adults, and discussing funeral plans are also less common among those age 40 to 54 compared to those in older age groups.
The likelihood of taking specific actions to plan for aging varies greatly by household income and educational attainment. Americans age 40 and older who report a household income of $50,000 or greater are more than twice as likely as those who earn less to set aside money to pay for their own care (45 percent vs. 19 percent) and look for information about long-term care insurance (38 percent vs. 18 percent). They are also more likely to create an advanced directive or living will (58 percent vs. 44 percent) and discuss funeral plans (70 percent vs. 60 percent) compared to those with a household income less than $50,000. Compared to those with at least a technical/trade school degree or some college, those with only a high school degree or less education are less likely to create an advanced directive or living will (56 percent vs. 45 percent), look for information about aging issues and ongoing living assistance (31 percent vs. 16 percent), and look for information about long-term care insurance (35 percent vs. 19 percent).
Across racial and ethnic groups, there are differences in reports of specific actions taken to plan for aging among Americans age 40 and older. While the majority of whites (57 percent) report creating an advanced directive or living will, only a minority of Hispanics (34 percent) and blacks (31 percent) report doing so. Whites are also more likely to set aside money to pay for care (38 percent) compared to Hispanics (25 percent) and blacks (15 percent). Similarly, whites are more likely to look for information about long-term care insurance (33 percent) compared to Hispanics (16 percent) and blacks (13 percent).
Those with experience with ongoing living assistance are more likely to report taking some actions to plan for aging needs than those without such experience. Seventy-two percent of Americans age 40 and older with long-term care experience have discussed preferences for funeral arrangements compared to 58 percent of those without prior experience with long-term care. Those with prior experience with long-term care are also more likely than those without such experience to modify their homes to make them easier to live in as they grow older (35 percent vs. 19 percent).
Americans Remain In Favor Of A Government-Administered Long-Term Care Insurance Program, And Majorities Support Other Policy Proposals To Address The Costs Of Long-Term Care.ꜛ
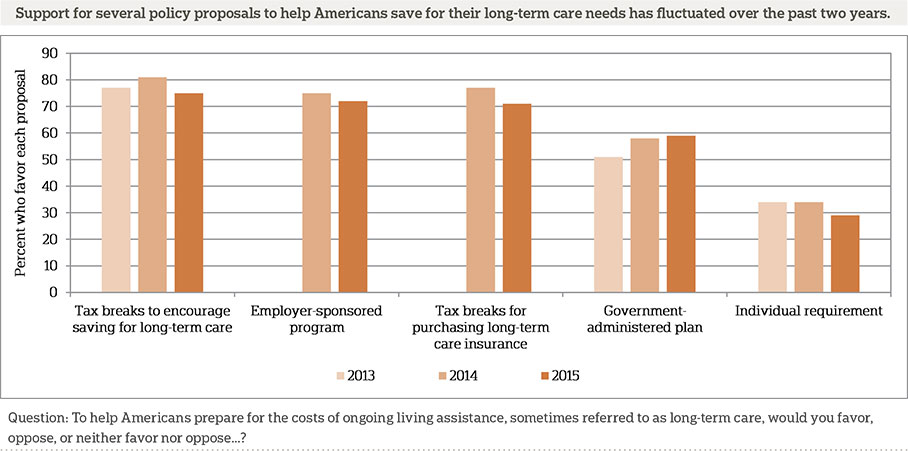
Attitudes toward several policy proposals to help Americans prepare for the costs of ongoing living assistance have fluctuated over the past two years. Support continues to be high for several policy changes, although the proposal for a requirement that individuals purchase long-term care insurance remains unpopular.
Even fewer Americans age 40 and older now say they support a requirement that individuals purchase private long-term care insurance than a year ago when 34 percent of Americans said they support this proposal. In 2015, just 29 percent of Americans age 40 and older say they support this type of mandate.
Though large majorities of Americans age 40 and older support two different tax incentive proposals, support for each has also declined since 2014. Seventy-five percent of Americans say they support a policy proposal that would create tax breaks to encourage saving for ongoing living assistance expenses, representing a 6 percentage point decline in support from 81 percent in 2014. Seventy-one percent of Americans age 40 and older say they support a policy proposal that would create tax breaks for consumers who purchase long-term care insurance, down from 77 percent in 2014.
Support for a government-administered long-term care program has continued trending upward since 2013, when just over half (51 percent) of Americans age 40 and older said they support this type of proposed program. Today, 59 percent say they favor this proposal.
Americans age 40 and older remain in strong support of a proposal that would give individuals the ability to purchase long-term care insurance through their employer that would be portable if they leave the job, similar to COBRA insurance. Seventy-two percent say they favor this proposal to help Americans prepare for long-term care, similar to findings in the 2014 survey.
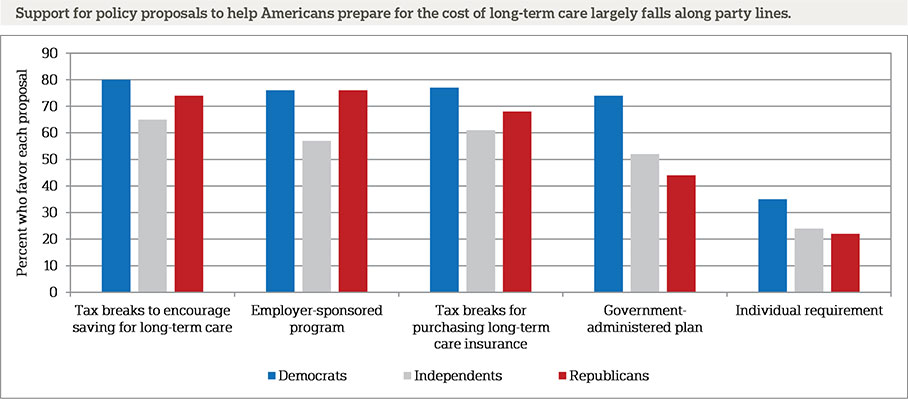
Just as the 2013 and 2014 studies revealed, support for the various approaches to helping Americans prepare for the high cost of long-term care varies significantly by political party. Democrats are more likely than Republicans to support a requirement that individuals purchase long-term care insurance (35 percent vs. 22 percent). Three-quarters of Democrats support a proposal that would create a government-administered long-term care program, while roughly half of independents (52 percent) and 44 percent of Republicans support this proposal. Democrats (80 percent) are more likely than either Republicans (74 percent) or independents (65 percent) to support tax breaks to encourage saving for long-term care expenses. Democrats are more likely than independents to favor tax breaks for purchasing long-term care insurance but are no more likely than Republicans to do so (77 percent of Democrats vs. 61 percent of independents and 68 percent of Republicans). Americans age 40 and older across political parties do not differ in their support for an employer-sponsored long-term care insurance plan.
About The Studyꜛ
Study Methodology
This survey, funded by The SCAN Foundation, was conducted by The Associated Press-NORC Center for Public Affairs Research between the dates of April 7 and May 15, 2015. Staff from NORC at the University of Chicago, The Associated Press, and The SCAN Foundation collaborated on all aspects of the study.
This survey of the 50 states and the District of Columbia was conducted via telephone with 1,735 adults age 40 and older. In households with more than one adult 40 and older, we used a process that randomly selected which eligible adult would be interviewed. The sample included 1,130 respondents on landlines and 605 respondents on cell phones. The sample also included an oversample of Californians 40 years and older. The sample includes 460 residents of California age 40 and older. In addition, the sample included an oversample of Hispanics 40 years and older. The sample includes 419 Hispanics age 40 and older.
Respondents on landline phones were selected randomly within households. For households with two eligible adults age 40 and older, one respondent was selected randomly by the CATI system. For households with three adults or more age 40 and older, the respondent who most recently celebrated a birthday at the time of the call was selected. If the selected respondent was not available at the time of the call, interviewers were trained to set up a time to call back to speak with that respondent. To avoid an imbalance of older respondents on landline telephones, an additional screening criterion was added after we had surpassed the population proportion of adults age 65 and older (using ACS9 and NHIS10 estimates), such that landline households where all adults are age 65 and older were ineligible after this point. We continued to interview some adults age 65 and older after this point, on cell phones and in households reached via landline where at least one adult was under the age of 65. Cell phone respondents were offered a monetary incentive of $5 for participating, as compensation for telephone usage charges. Interviews were conducted in both English and Spanish, depending on respondent preference. All interviews were completed by professional interviewers who were carefully trained on the specific survey for this study.
The random digit dial sample, including the California oversample, was provided by a third-party vendor, Marketing Systems Group. The final response rate for the overall sample was 11 percent, based on the American Association of Public Opinion Research Response Rate 3 Method. Additionally, the final response rate for the California sample was 11 percent, and the final response rate for the Hispanic sample was 3 percent.
The sampling frame utilizes the standard dual telephone frames (landline and cell), with an oversample of numbers from the state of California, and a supplemental sample of both landline and cell numbers targeting households with Hispanic adults. The targeted sample was provided by Scientific Telephone Samples and was pulled from a number of different commercial consumer databases and demographic data. Sampling weights were calculated to adjust for sample design aspects (such as unequal probabilities of within household selection) and for nonresponse bias arising from differential response rates across various demographic groups. Poststratification variables included age, sex, race, region, education, and landline/cell phone use. The weighted data, which thus reflect the U.S. population, were used for all analyses. The overall margin of sampling error was +/- 3.2 percentage points, adjusted for design effect resulting from the complex sample design. The California sample’s margin of sampling error was +/- 5.4 percentage points, and the Hispanic sample’s margin of sampling was +/- 6.0 percentage points, both also adjusted for design effect resulting from the complex sample design.
All analyses were conducted using STATA (version 13), which allows for adjustment of standard errors for complex sample designs. All differences reported between subgroups of the U.S. population are at the 95 percent level of statistical significance, meaning that there is only a 5 percent (or less) probability that the observed differences could be attributed to chance variation in sampling. Additionally, bivariate differences between subgroups are only reported when they also remain robust in a multivariate model controlling for other demographic, political, and socioeconomic covariates. A comprehensive listing of all study questions, complete with tabulations of top-level results for each question, is available on The AP-NORC Center for Public Affairs Research long-term care website: www.longtermcarepoll.org.
About The Associated Press-NORC Center for Public Affairs Research
The AP-NORC Center for Public Affairs Research taps into the power of social science research and the highest-quality journalism to bring key information to people across the nation and throughout the world.
- The Associated Press (AP) is the world’s essential news organization, bringing fast, unbiased news to all media platforms and formats.
- NORC at the University of Chicago is one of the oldest and most respected, independent research institutions in the world.
The two organizations have established The AP-NORC Center for Public Affairs Research to conduct, analyze, and distribute social science research in the public interest on newsworthy topics, and to use the power of journalism to tell the stories that research reveals. The founding principles of The AP-NORC Center include a mandate to carefully preserve and protect the scientific integrity and objectivity of NORC and the journalistic independence of AP. All work conducted by the Center conforms to the highest levels of scientific integrity to prevent any real or perceived bias in the research. All of the work of the Center is subject to review by its advisory committee to help ensure it meets these standards. The Center will publicize the results of all studies and make all datasets and study documentation available to scholars and the public.
The complete topline data are available at www.longtermcarepoll.org.
Contributing Researchers
From NORC at the University of Chicago
Jennifer Benz
Becky Reimer
Dan Malato
Trevor Tompson
Emily Alvarez
David Sterrett
Jennifer Titus
Ivana Cvarkovic
Elizabeth Kantor
Marjorie Connelly
Wei Zeng
Jie Zhao
From The Associated Press
Emily Swanson
Footnotesꜛ
1. Administration on Aging. 2014. A Profile of Older Americans: 2014. https://www.acl.gov/sites/default/files/Aging%20and%20Disability%20in%20America/2014-Profile.pdfꜛ
2. U.S. Department of Health and Human Services. 2015. National Clearinghouse for Long-Term Care Information. http://longtermcare.gov/the-basics/ꜛ
3. AP-NORC Center for Public Affairs Research. 2013. Long-Term Care: Perceptions, Experiences, and Attitudes among Americans 40 or Older. http://www.apnorc.org/PDFs/Long%20Term%20Care/AP_NORC_Long%20Term%20Care%20Perception_FINAL%20REPORT.pdf ꜛ
4. AP-NORC Center for Public Affairs Research. 2014. Long-Term Care in America: Expectations and Reality. https://www.longtermcarepoll.org/Pages/Polls/Report.aspxꜛ
5. For the purpose of the survey, the phrase “ongoing living assistance” was used in place of long-term care and was defined as “…help with things like keeping house, cooking, bathing, getting dressed, getting around, paying bills, remembering to take medicine, or just having someone check in to see that everything is okay. This help can happen at your own home, in a family member’s home, in a nursing home, or in a senior community. And, it can be provided by a family member, a friend, a volunteer, or a health care professional.”ꜛ
6. Those who live in nursing homes and have either direct landline phone numbers or cell phones were just as likely as other Americans to be included in the survey. Individuals who are currently staying in hospitals or skilled nursing facilities may have been less likely to be included in the survey if those facilities did not have direct phone lines in each room. The term “nursing home” was not defined for respondents.ꜛ
7. Home health care aide costs are based on 44 hours per week for 52 weeks, and nursing home care costs are based on private room care for 365 days per year. (Source: Genworth Financial Inc., 2015, Genworth 2015 Cost of Care Survey, https://www.genworth.com/corporate/about-genworth/industry-expertise/cost-of-care.html)ꜛ
8. Kaiser Commission on Medicaid and the Uninsured. 2015. Medicaid and Long-Term Services and Supports: A Primer. http://kff.org/medicaid/report/medicaid-and-long-term-services-and-supports-a-primer/ꜛ
9. United States Census Bureau. 2014. American Community Survey (ACS). http://www.census.gov/acs/www/data_documentation/2013_release/ꜛ
10. Centers for Disease Control and Prevention. 2014. National Health Interview Survey (NHIS). http://www.cdc.gov/nchs/nhis/nhis_2013_data_release.htmꜛ