
©iStock/Diego Cervo
The Associated Press-NORC Center for Public Affairs Research is conducting a series of studies to explore expectations and preparation for, and attitudes towards, long-term care among Americans age 40 and older. These studies have included deeper analysis of the experiences of Hispanics, an important and growing demographic group.
The results of the survey indicate that, like older Americans overall, most Hispanics age 40 and older wish to receive ongoing living assistance in their own home, and they would prefer for a loved one needing care to move in with them as well, so they could provide care in their own home rather than in the home of the loved one. The survey also reveals that many older Hispanics expect to provide care to an aging family member or friend in the next five years, though few feel prepared to do so. They express moderate levels of concern about a variety of issues that could arise with aging, including losing their memory or other mental abilities, losing their independence and having to rely on others, and leaving debts to their family.
The U.S. Census estimates that the Hispanic population will more than double by the year 2060, and Hispanics age 65 and older are expected to make up 21 percent of Americans in that age group.1 The portion of the country’s overall population age 65 and older is expected to spike in the coming years,2 and, with a majority of these seniors expected to need help with daily activities like cooking, bathing, or remembering to take medicine,3 the study of attitudes on this specific issue among this specific group becomes all the more critical.
The 2016 study, funded by The SCAN Foundation, includes interviews completed with a nationally representative sample of 1,698 Americans age 40 and older, including oversamples of 400 Hispanics and 526 residents of California.
Key findings among Hispanics 40 and older include:
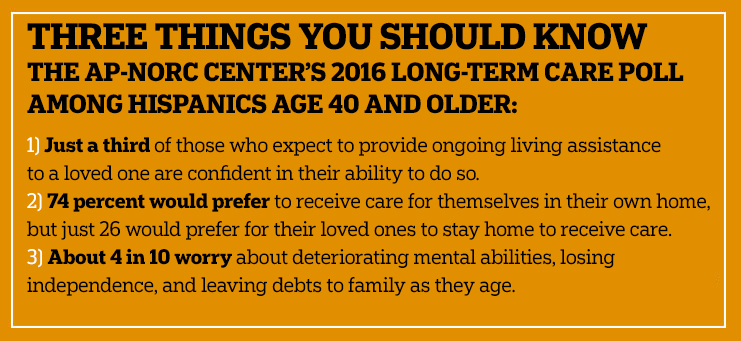
- Half expect a close friend or family member to require care in the next five years, though just a third of those who expect to provide that care themselves are confident in their ability to do so.
- About half say it is at least somewhat likely that they will need ongoing living assistance4 someday, and most (74 percent) say they would like to receive that care in their own home.
- Though most would want to receive care in their own homes, they would prefer for a loved one needing care to move in with them so that they could provide care in their own home rather than in their loved one’s home.
- Hispanics express moderate worry about a variety of issues they may experience as they age, including deteriorating mental abilities and losing their independence, though rates of concern are on the decline compared to past years.
- Forty percent are either currently providing care or have done so in the past, and 4 in 10 of them have had to miss work at some point because of it.
- Confidence in their ability to pay for long-term care is low but on the rise, increasing from 23 percent in 2015 to 33 percent in 2016.
- Nearly 4 in 10 expect to rely heavily on Medicare to support the care they need as they grow older, despite the fact that Medicare does not pay for many long-term care services.
- Three-quarters favor a paid family leave program that would provide paid time off for those who need to care for a family member. Other programs to help caregivers with the costs of providing care also enjoy broad support.
- Majorities support policies aimed at helping individuals prepare for the costs of care, including government-administered long-term care insurance programs and tax breaks to encourage saving for care.
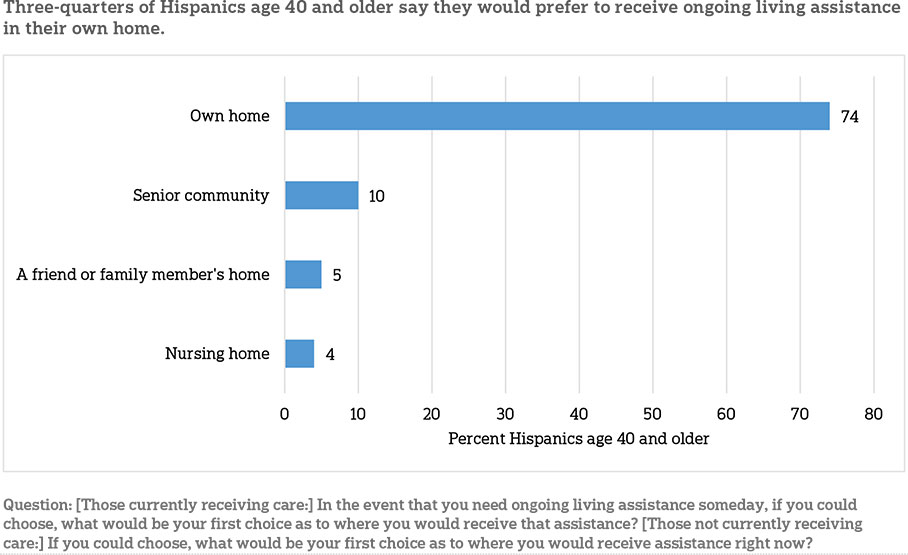
About Half Of Hispanics Age 40 And Older Say It Is Likely They Will Need Care In The Future, And They Overwhelmingly Would Prefer To Receive That Care In Their Own Home.ꜛ
Just under 1 in 10 Hispanics age 40 and older report being recipients of ongoing living assistance, either currently or in the past. Among those not receiving care currently, 14 percent say it is very or extremely likely they will need care as they age, and an additional 37 percent say they are somewhat likely. This represents a decrease compared to 2015 when 22 percent said it was at least very likely they would need care in the future.
When asked where they would like to receive that care, older Hispanics overwhelmingly would prefer to receive care in their own home (74 percent). Few say they would like to receive care in a senior community (10 percent), a friend or family member’s home (5 percent), or a nursing home (4 percent). Most are confident they will receive care in their ideal location. More than half (55 percent) say it is very or extremely likely they will receive care in their preferred location, and 27 percent say it is somewhat likely. Just 10 percent say it is not too or not at all likely.
Among those who want to receive care in their own home or a friend or family member’s home, one’s spouse was the most popular choice for who would provide that care (38 percent). About a quarter (28 percent) say they would like to receive care from their children. Fewer say they would prefer a professional home health care aide (14 percent) or another relative besides their spouse or children (11 percent). Hispanics age 40 and older are less likely than non-Hispanics (23 percent) to say they would prefer care from a professional home health aide. Additionally, Hispanics age 40 and older who earn $50,000 or more are more likely than those earning less than $50,000 to prefer a professional home health aide (24 percent vs. 6 percent).
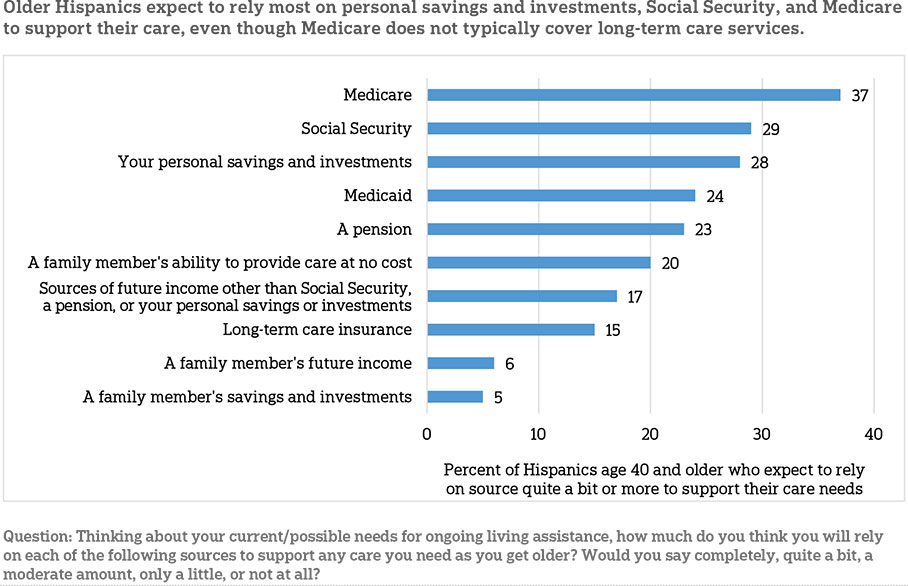
Similar To Americans Overall, Confidence In Financial Preparedness For Long-Term Care Is Low Among Hispanics, And They Expect To Rely Most Heavily On Medicare, Social Security, And Their Own Savings To Support Their Care Needs.ꜛ
Confidence among Hispanics age 40 and older about whether they will have the financial resources to pay for long-term care as they grow older is on the rise, but a majority still do not feel confident. Thirty-three percent say they are very or extremely confident they will have the financial resources to pay for care, up from 23 percent in 2015. Still, 28 percent are just somewhat confident, and 36 percent are not too or not confident at all.
Among Hispanics age 40 and older, those earning $50,000 a year or more express more confidence in their ability to pay for care than those earning less. More than half (53 percent) say they are very or extremely confident compared to just 21 percent of those earning less than $50,000 a year. Additionally, those with experience with long-term care, either as a recipient, a caregiver, or someone who pays for care, are less confident than those without experience. Just 23 percent express confidence compared to 41 percent of those without experience.
Overall, Americans age 40 and older most often say they expect to rely on Medicare, Social Security, and their personal savings and investments to help pay for care they may need as they get older. Hispanics age 40 and older are similar. Even though Medicare does not typically cover most long-term care needs like nursing home stays or in-home health aides, 37 percent say they expect to rely completely or quite a bit on it. Twenty-nine percent expect to rely on Social Security, and 28 percent expect to rely on their personal savings and investments. Just a quarter expect to rely on Medicaid, despite the fact that Medicaid is the largest public payer of long-term care services in the United States.5 About 2 in 10 anticipate relying on a pension, a family member’s ability to provide care at no cost, or sources of income other than Social Security, a pension, or their personal savings or investments. Few expect to rely on a family member’s savings, investments, or future income. Fifteen percent expect to rely on long-term care insurance.
Hispanics age 40 and older differ from non-Hispanics on two sources of expected support—Social Security and pensions. Older Hispanics are less likely than non-Hispanics to say they will rely on Social Security (29 percent vs. 36 percent). Additionally, just 46 percent say they will rely on a pension only a little or not at all compared to 57 percent of non-Hispanics age 40 and older.
Differences emerge in expected sources of support among Hispanics age 40 and older based on income, gender, and employment status.
Those with incomes of $50,000 or more are more likely than those who earn less than $50,000 to say they will rely on personal savings (40 percent vs. 19 percent). They are less likely to say they will rely on Medicare (28 percent vs. 43 percent), Medicaid (17 percent vs. 30 percent), and a family member’s future income (82 percent will not rely on this vs. 66 percent). Men are more likely than women to say they will not rely on a family member providing no-cost care (65 percent will not vs. 45 percent). Those who are unemployed expect to rely less on long-term care insurance than those who are employed (51 percent will not vs. 35 percent).
Few Hispanics say they have actually set aside money to help pay for long-term care expenses. Most (70 percent) say they have not. Additionally, 28 percent say they think their current health insurance will pay for ongoing living assistance services should they need them, even though traditional health plans do not cover things like home health aides, nursing homes, and medical equipment like wheelchairs.
Most Hispanics Age 40 And Older Are Either Currently Providing Care Or Expect To In The Future.ꜛ
Four in 10 Hispanics age 40 and older report that they either currently provide ongoing living assistance to an aging family member or friend or have done so in the past. This rate remains steady when compared to the 2015 survey findings. Four percent also say they or someone in their family is currently employing someone to provide in-home ongoing living assistance. Of those who have ever provided care, nearly 4 in 10 say they have had to miss work to provide care.
For those not currently providing care, 49 percent say it is at least somewhat likely that an aging family member or friend will need ongoing living assistance in the next five years, and a third of that group thinks they will be responsible for providing that care. Few of these potential caregivers feel prepared to care for their loved one; just a third feel very or extremely prepared. However, this represents an increase compared to 2015 when just 15 percent said they felt prepared to provide care.
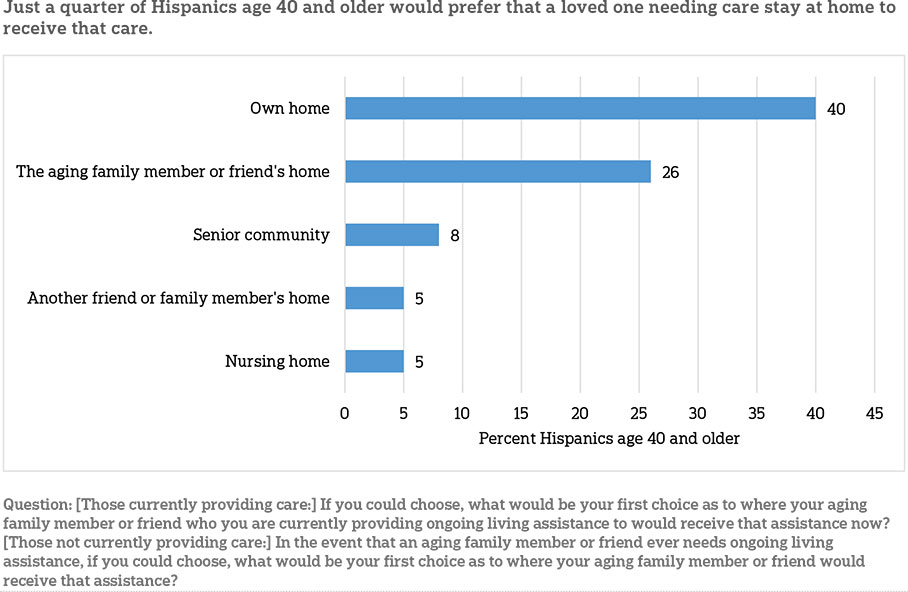
If A Family Member Were To Need Long-Term Care, More Older Hispanics Want To Provide That Care In Their Own Home Rather Than In The Home Of The Loved One.ꜛ
When asked about where they would like to see an aging family member or friend receive care in the event that they need it, older Hispanics who are not yet providing care most often cite their own home (40 percent), while an additional 26 percent say they would prefer their aging family member or friend’s home. Less than 10 percent say they would like to have their loved one receive care in a senior community (8 percent), a nursing home (5 percent), or another friend or family member’s home (5 percent). Of those not currently providing care, most are optimistic that their aging loved one will be able to receive care in that location. More than half (51 percent) say it is very or extremely likely they will receive care in that preferred location, and an additional 34 percent say it is somewhat likely. Just 10 percent say it is not too or not at all likely.
Of those currently providing care to a family member or friend, most say they are providing it in their own home (58 percent). A minority (35 percent) also say they are providing it in the home of their aging loved one.
This contrasts with where older Hispanics say they would like to receive care themselves. Most (74 percent) say they would like to receive care in their own home. Just 5 percent say they would want to receive it in the home of a family member or friend. But when asked about a loved one’s care, most want them to receive care outside the loved one’s home.
Differences in preferences emerge along education and gender lines. Those with more than a high school degree are more likely than those with only a high school degree to say they prefer their aging loved one receive care in that loved one’s home (36 percent vs. 21 percent). Additionally, 9 percent of men but just 1 percent of women say they would prefer that their loved one receive care in another friend or family member’s home.
Older Hispanics Support Paid Family Leave And Other Programs Aimed At Helping Caregivers.ꜛ
Three states, California, New Jersey, and Rhode Island, have programs in place to allow employees to take paid time off to care for a family member with a serious health condition, with beneficiaries typically receiving a portion of their salary during that time.6,7 New York state has also passed a bill that creates a paid family leave program, which will take effect in 2018. Currently, the federal government does not require companies to provide employees with paid time off to care for an aging family member, though presidential candidates and senators from both political parties have proposed such plans at the national level.8,9,10,11
Like Americans overall, Hispanics age 40 and older support a paid family leave program to allow workers to receive a portion of their salary while taking time off to care for an aging family member with a serious health condition. Seventy-four percent favor such a program compared to 7 percent who oppose. Twelve percent neither favor nor oppose.
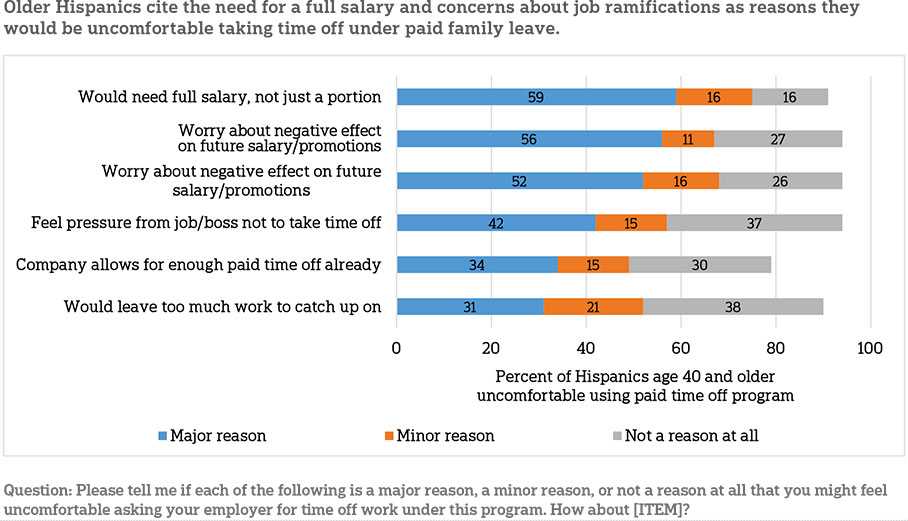
Of those currently employed but not self-employed, most would be willing to use a paid family leave program. Sixty-three percent say they would be very or extremely comfortable asking for time off under such a program, while 18 percent say they would only be somewhat comfortable and 13 percent would be not too or not at all comfortable. Those who say they would be uncomfortable using a paid family leave program cite reasons like the need for a full salary, worry about losing their job, and negative effects on future salary and promotion opportunities as major reasons why they might be hesitant to ask for time off.
Presidential candidates have proposed other programs in addition to paid family leave to provide financial assistance to those providing ongoing assistance to a family member.12,13 As among Americans overall, these proposals enjoy broad support among Hispanics age 40 and older. More than 8 in 10 (82 percent) favor providing tax breaks for people who provide care to a family member. More than 6 in 10 (65 percent) favor changing Social Security rules to give earnings credit to caregivers who leave the workforce to provide care to a family member. These policies enjoy majority support among Hispanic Democrats, independents, and Republicans.
About Half Of Hispanics Support A Government-Administered Long-Term Care Insurance Program, With Other Policies To Help Americans Prepare For Costs Of Care Enjoying Even Higher Levels Of Support.ꜛ
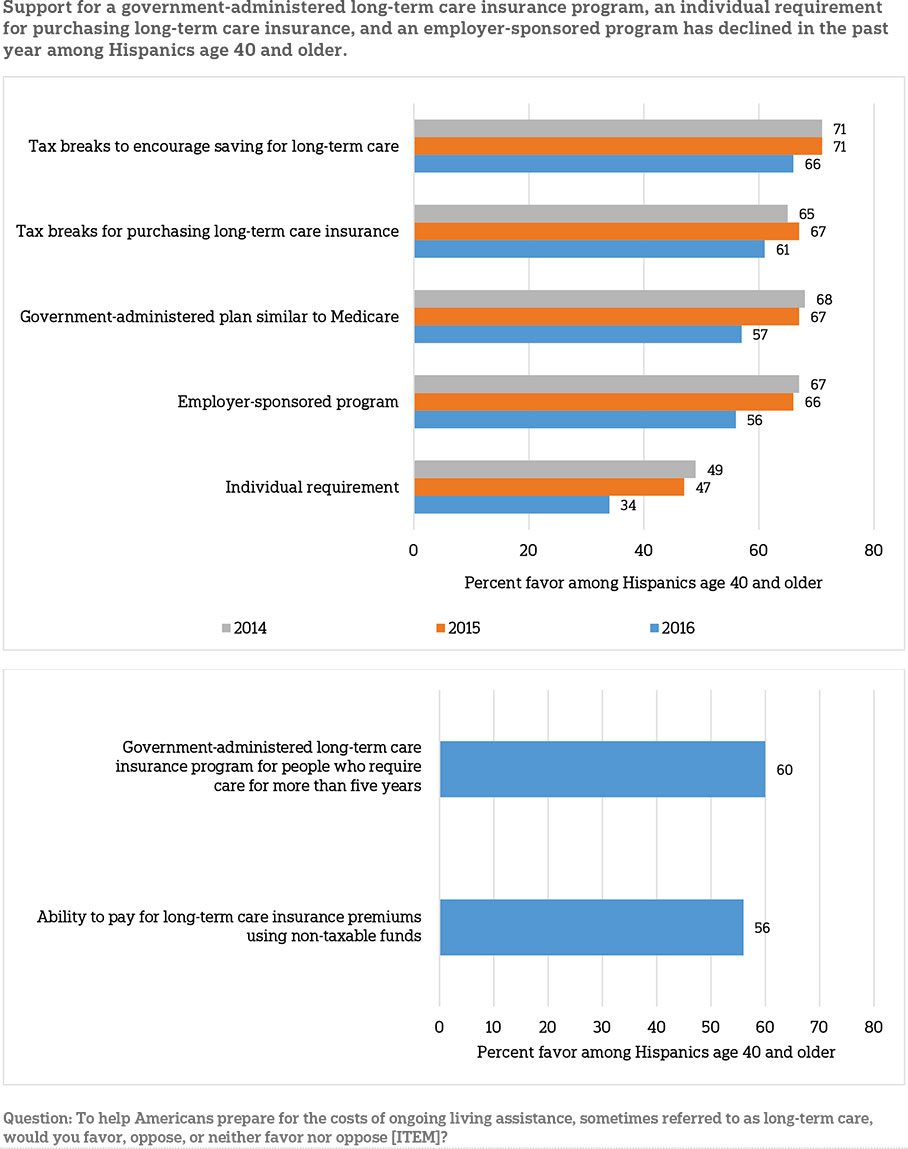
Majorities of Hispanics age 40 and older continue to favor several policy proposals designed to help Americans prepare for the costs of ongoing living assistance, though support has declined among the group for some of these policies in the past year.
Hispanics age 40 and older favor using tax breaks to provide relief for the financial burden of paying for long-term care. Sixty-six percent favor tax breaks to encourage savings for ongoing living assistance expenses, similar to the 71 percent who favored it in 2014 and 2015. Tax breaks for consumers who purchase long-term care insurance also enjoy high support (61 percent), similar to past years.
Support for a government-administered long-term care insurance program similar to Medicare has fallen from 67 percent among Hispanics age 40 and older in 2015 to 57 percent in 2016, though this still represents a majority. Hispanic Democrats are more supportive of such a program compared to Hispanic Republicans (70 percent vs. 40 percent). A similar program, a government-administered long-term care insurance program for people who require care for more than five years, which is a longer period of time than is typically covered by private long-term care insurance, also enjoys majority support (60 percent). This policy was not asked about prior to 2016.
Fifty-six percent favor a program that would give individuals the ability to purchase long-term care insurance through their employer and that is portable if they continue to pay the premium after leaving their job, similar to COBRA. Support among Hispanics age 40 and older has declined 10 percentage points since 2015, however.
A majority (56 percent) of older Hispanics also favor letting individuals use non-taxable funds such as an IRA or 401(k) to pay long-term care insurance premiums. Differences in support emerge by income, with 82 percent of those earning $50,000 or more saying they favor such a policy compared to 53 percent of those earning less than $50,000.
Those with more education are particularly favorable toward several of these policies. Those with more than a high school education are more likely to support tax breaks to encourage saving for ongoing living assistance expenses compared to those with only a high school degree (84 percent vs. 57 percent) and tax breaks for those who purchase long-term care insurance (78 percent vs. 53 percent). They are also more likely to favor portable long-term care insurance (67 percent vs. 50 percent).
One proposed policy faces more opposition than support: a requirement for individuals to purchase long-term care insurance. Though Hispanics age 40 and older favor such a program at higher rates than non-Hispanics (34 percent vs. 24 percent), support is still below a majority and has dropped by more than 10 points compared to 2015, when support among older Hispanics was at 47 percent.
When It Comes To Concerns About Aging, Hispanics Are Most Worried About Deteriorating Mental Abilities And Losing Their Independence, Though Concern Has Decreased Since 2015.ꜛ
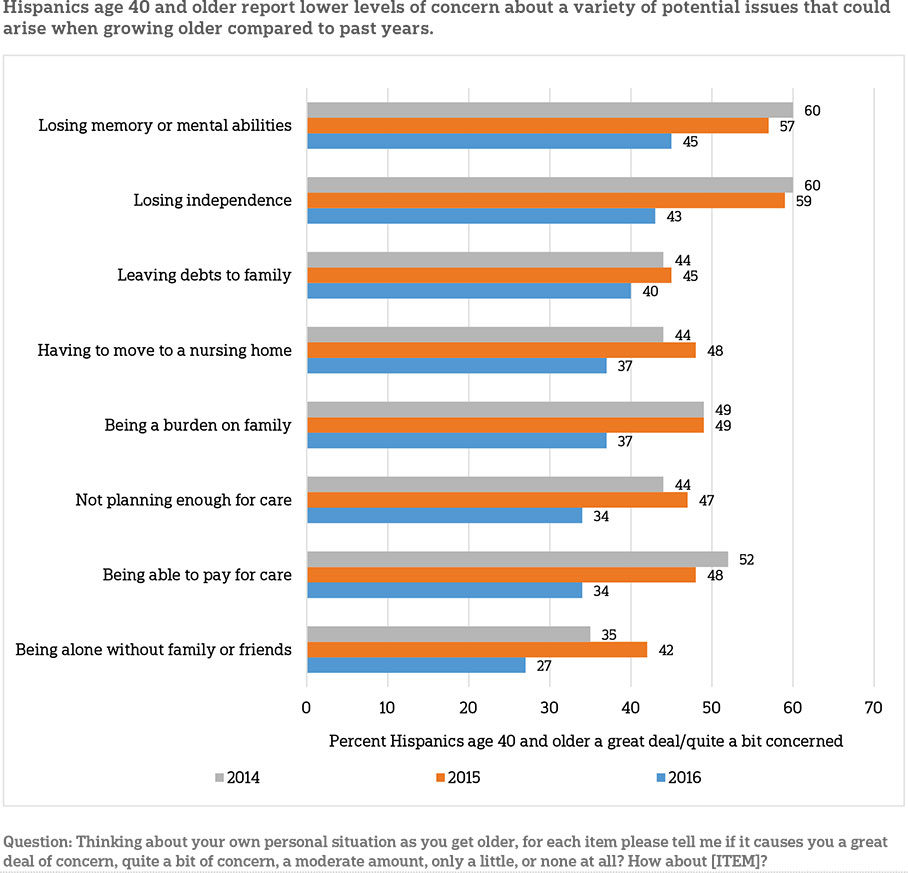
Hispanics age 40 and older expressed moderate levels of concern about a variety of things they may experience as they age. About 4 in 10 say they are a great deal or quite a bit concerned about things like losing their memory or other mental abilities, losing their independence and having to rely on others, and leaving debts to their family. More than 3 in 10 express concern about having to leave their home and move to a nursing home, being a burden on their family, and not planning enough for care they may need as they age. A quarter say they worry about being alone without family or friends. Levels of concern about nearly all of these issues has declined since 2015.
Subgroups of Hispanics are more concerned about some of these issues. Hispanics age 40-54 express greater concern than those age 65 and older about leaving debts to their family (44 percent vs. 24 percent), being a burden on their family (41 percent vs. 23 percent), having to leave their home and move into a nursing home (40 percent vs. 24 percent), and paying for the care they may need as they grow older (40 percent vs. 20 percent). Hispanics age 40 and older with any experience with long-term care are also more concerned about leaving debts to their family than those without experience (49 percent vs. 31 percent).
Planning For Care Among Hispanics Age 40 And Older Remains Low, And Older Hispanics Are Less Likely Than Non-Hispanics To Have Taken Several Specific Actions To Prepare For Aging.ꜛ
Reported levels of planning for long-term care remain low among older Hispanics. Six in 10 say they have done little or no planning at all for their own needs, about the same as in 2015. Still, many have done at least something to prepare for living assistance. When asked about several specific planning actions, like discussing preferences for long-term care with family or modifying their home to make it easier to live in as they age, 71 percent say they have done at least one. This also remains unchanged from past years and is similar to the rate among non-Hispanics.
The most common planning actions were discussing preferences for funeral arrangements (46 percent), discussing preferences for the kinds of ongoing living assistance they want (32 percent), and creating a living will (30 percent). Again, these rates have moved very little compared to past years. Fewer older Hispanics have taken several of these planning actions compared to non-Hispanics, however, including discussing funeral preferences (46 percent vs. 70 percent), creating a living will (30 percent vs. 59 percent), and moving to a senior community (3 percent vs. 9 percent).
Differences emerge by age, education, and experience with long-term care. Hispanics age 65 and older or more likely than those age 40-64 to have discussed funeral preferences (63 percent vs. 43 percent) or created a living will (42 percent vs. 27 percent). Those with more than a high school education are more likely than those with only a high school degree to have discussed funeral preferences (63 percent vs. 38 percent), discussed preferences for care (47 percent vs. 25 percent), looked for information on long-term care insurance (33 percent vs. 8 percent), and looked for information on aging issues (26 percent vs. 9 percent). Older Hispanics with any experience with long-term care are more likely to have looked for information on long-term care insurance (22 percent vs. 11 percent).
About the Studyꜛ
Survey Methodology
This study, funded by The SCAN Foundation, was conducted by The Associated Press-NORC Center for Public Affairs Research. Interviews were conducted by Interviewing Services of America between the dates of February 18 and April 9, 2016. Staff from NORC at the University of Chicago, The Associated Press, and The SCAN Foundation collaborated on all aspects of the study.
This survey of the 50 states and the District of Columbia was conducted via telephone with 1,698 adults age 40 and older. The sample included 1,117 respondents on landlines and 581 respondents on cell phones. The sample also included an oversample of Californians age 40 years and older. The sample includes 526 residents of California age 40 and older. In addition, the sample included an oversample of Hispanics age 40 years and older. The sample includes 400 Hispanics age 40 and older.
Respondents on landline phones were selected randomly within households. For households with two eligible adults age 40 and older, one respondent was selected randomly by the computer-assisted telephone interviewing system. For households with three adults or more age 40 and older, the respondent who most recently celebrated a birthday at the time of the call was selected. If the selected respondent was not available at the time of the call, interviewers were trained to set up a time to call back to speak with that respondent. Interviews were conducted in both English and Spanish, depending on respondent preference. All interviews were completed by professional interviewers who were carefully trained on the specific survey for this study.
The random digit dial sample, including the California oversample, was provided by a third-party vendor, Scientific Telephone Samples. The final response rate for the overall sample was 37 percent, based on the American Association of Public Opinion Research Response Rate 3 Method. Additionally, the final response rate for the California sample was 40 percent, and the final response rate for the Hispanic sample was 15 percent.
The sampling frame utilizes the standard dual telephone frames (landline and cell), with an oversample of numbers from the state of California, and a supplemental sample of both landline and cell numbers targeting households with Hispanic adults. The targeted sample was provided by Scientific Telephone Samples and Marketing Systems Group and was pulled from a number of different commercial consumer databases and demographic data.
Sampling weights were calculated to adjust for sample design aspects (such as unequal probabilities of within household selection) and for nonresponse bias arising from differential response rates across various demographic groups. Poststratification variables included age, sex, race, region, education, and landline/cell phone use. The weighted data, which thus reflect the U.S. population, were used for all analyses. The overall margin of sampling error was +/- 3.4 percentage points, adjusted for design effect resulting from the complex sample design. The California sample’s margin of sampling error was +/- 5.5 percentage points, and the Hispanic sample’s margin of sampling error was +/- 6.7 percentage points, both also adjusted for design effect resulting from the complex sample design.
All analyses were conducted using STATA (version 14), which allows for adjustment of standard errors for complex sample designs. All differences reported between subgroups of the U.S. population are at the 95 percent level of statistical significance, meaning that there is only a 5 percent (or less) probability that the observed differences could be attributed to chance variation in sampling. Additionally, bivariate differences between subgroups are only reported when they also remain robust in a multivariate model controlling for other demographic, political, and socioeconomic covariates.
A comprehensive listing of all study questions, complete with tabulations of top-level results for each question, is available on The AP-NORC Center for Public Affairs Research long-term care website: www.longtermcarepoll.org.
Contributing Researchers
From NORC at the University of Chicago
Jennifer Benz
Dan Malato
Jennifer Titus
Alejandra Cancino
Trevor Tompson
Wei Zeng
Jason Rajan
Ivana Cvarkovic
Liz Kantor
From The Associated Press
Emily Swanson
About the Associated Press-NORC Center for Public Affairs Research
The AP-NORC Center for Public Affairs Research taps into the power of social science research and the highest-quality journalism to bring key information to people across the nation and throughout the world.
- The Associated Press (AP) is the world’s essential news organization, bringing fast, unbiased news to all media platforms and formats.
- NORC at the University of Chicago is one of the oldest and most respected, independent research institutions in the world.
The two organizations have established The AP-NORC Center for Public Affairs Research to conduct, analyze, and distribute social science research in the public interest on newsworthy topics, and to use the power of journalism to tell the stories that research reveals.
The founding principles of The AP-NORC Center include a mandate to carefully preserve and protect the scientific integrity and objectivity of NORC and the journalistic independence of AP. All work conducted by the Center conforms to the highest levels of scientific integrity to prevent any real or perceived bias in the research. All of the work of the Center is subject to review by its advisory committee to help ensure it meets these standards. The Center will publicize the results of all studies and make all datasets and study documentation available to scholars and the public.
The complete topline data are available at www.longtermcarepoll.org.
Footnotesꜛ
1. U.S. Census Bureau. 2015. Projections of the Size and Composition of the U.S. Population: 2014 to 2060. https://www.census.gov/content/dam/Census/library/publications/2015/demo/p25-1143.pdfꜛ
2. Administration on Aging. 2014. A Profile of Older Americans: 2014. https://www.acl.gov/sites/default/files/Aging%20and%20Disability%20in%20America/2014-Profile.pdf ꜛ
3. U.S. Department of Health and Human Services. 2015. National Clearinghouse for Long-Term Care Information. http://longtermcare.gov/the-basics/ꜛ
4. For the purpose of the survey, the phrase “ongoing living assistance” was used in place of long-term care and was defined as “…help with things like keeping house, cooking, bathing, getting dressed, getting around, paying bills, remembering to take medicine, or just having someone check in to see that everything is okay. This help can happen at your own home, in a family member’s home, in a nursing home, or in a senior community. And, it can be provided by a family member, a friend, a volunteer, or a health care professional.”ꜛ
5. Kaiser Commission on Medicaid and the Uninsured. 2015. Medicaid and Long-Term Services and Supports: A Primer. http://kff.org/medicaid/report/medicaid-and-long-term-services-and-supports-a-primer/ꜛ
6. Kaiser Family Foundation. 2014. Balancing on shaky ground: women, work, and family health. Data Note. http://files.kff.org/attachment/balancing-on-shaky-ground-women-work-and-family-health-data-noteꜛ
7. National Partnership for Women and Families. 2016. State Paid Family Leave Insurance Laws. http://www.nationalpartnership.org/research-library/work-family/paid-leave/state-paid-family-leave-laws.pdfꜛ
8. Hillary for America. 2016. Paid Family and Medical Leave: It’s Time to Guarantee Paid Family and Medical Leave in America. https://www.hillaryclinton.com/issues/paid-leave/ꜛ
9. https://marcorubio.comꜛ
10. http://www.king.senate.gov/download/?id=47B89267-C4AA-4C33-889B-995761622661&inline=fileꜛ
11. http://www.gillibrand.senate.gov/issues/paid-family-medical-leaveꜛ
12. Hillary for America. 2016. Hillary Clinton’s Plan to Invest in the Caring Economy: Recognizing the Value of Family Caregivers and Home Care Workers. https://www.hillaryclinton.com/briefing/factsheets/2015/11/22/caring-economy/ꜛ
13. Bernie 2016. 2016. Strengthen and Expand Social Security. https://berniesanders.com/issues/strengthen-and-expand-social-security/ꜛ