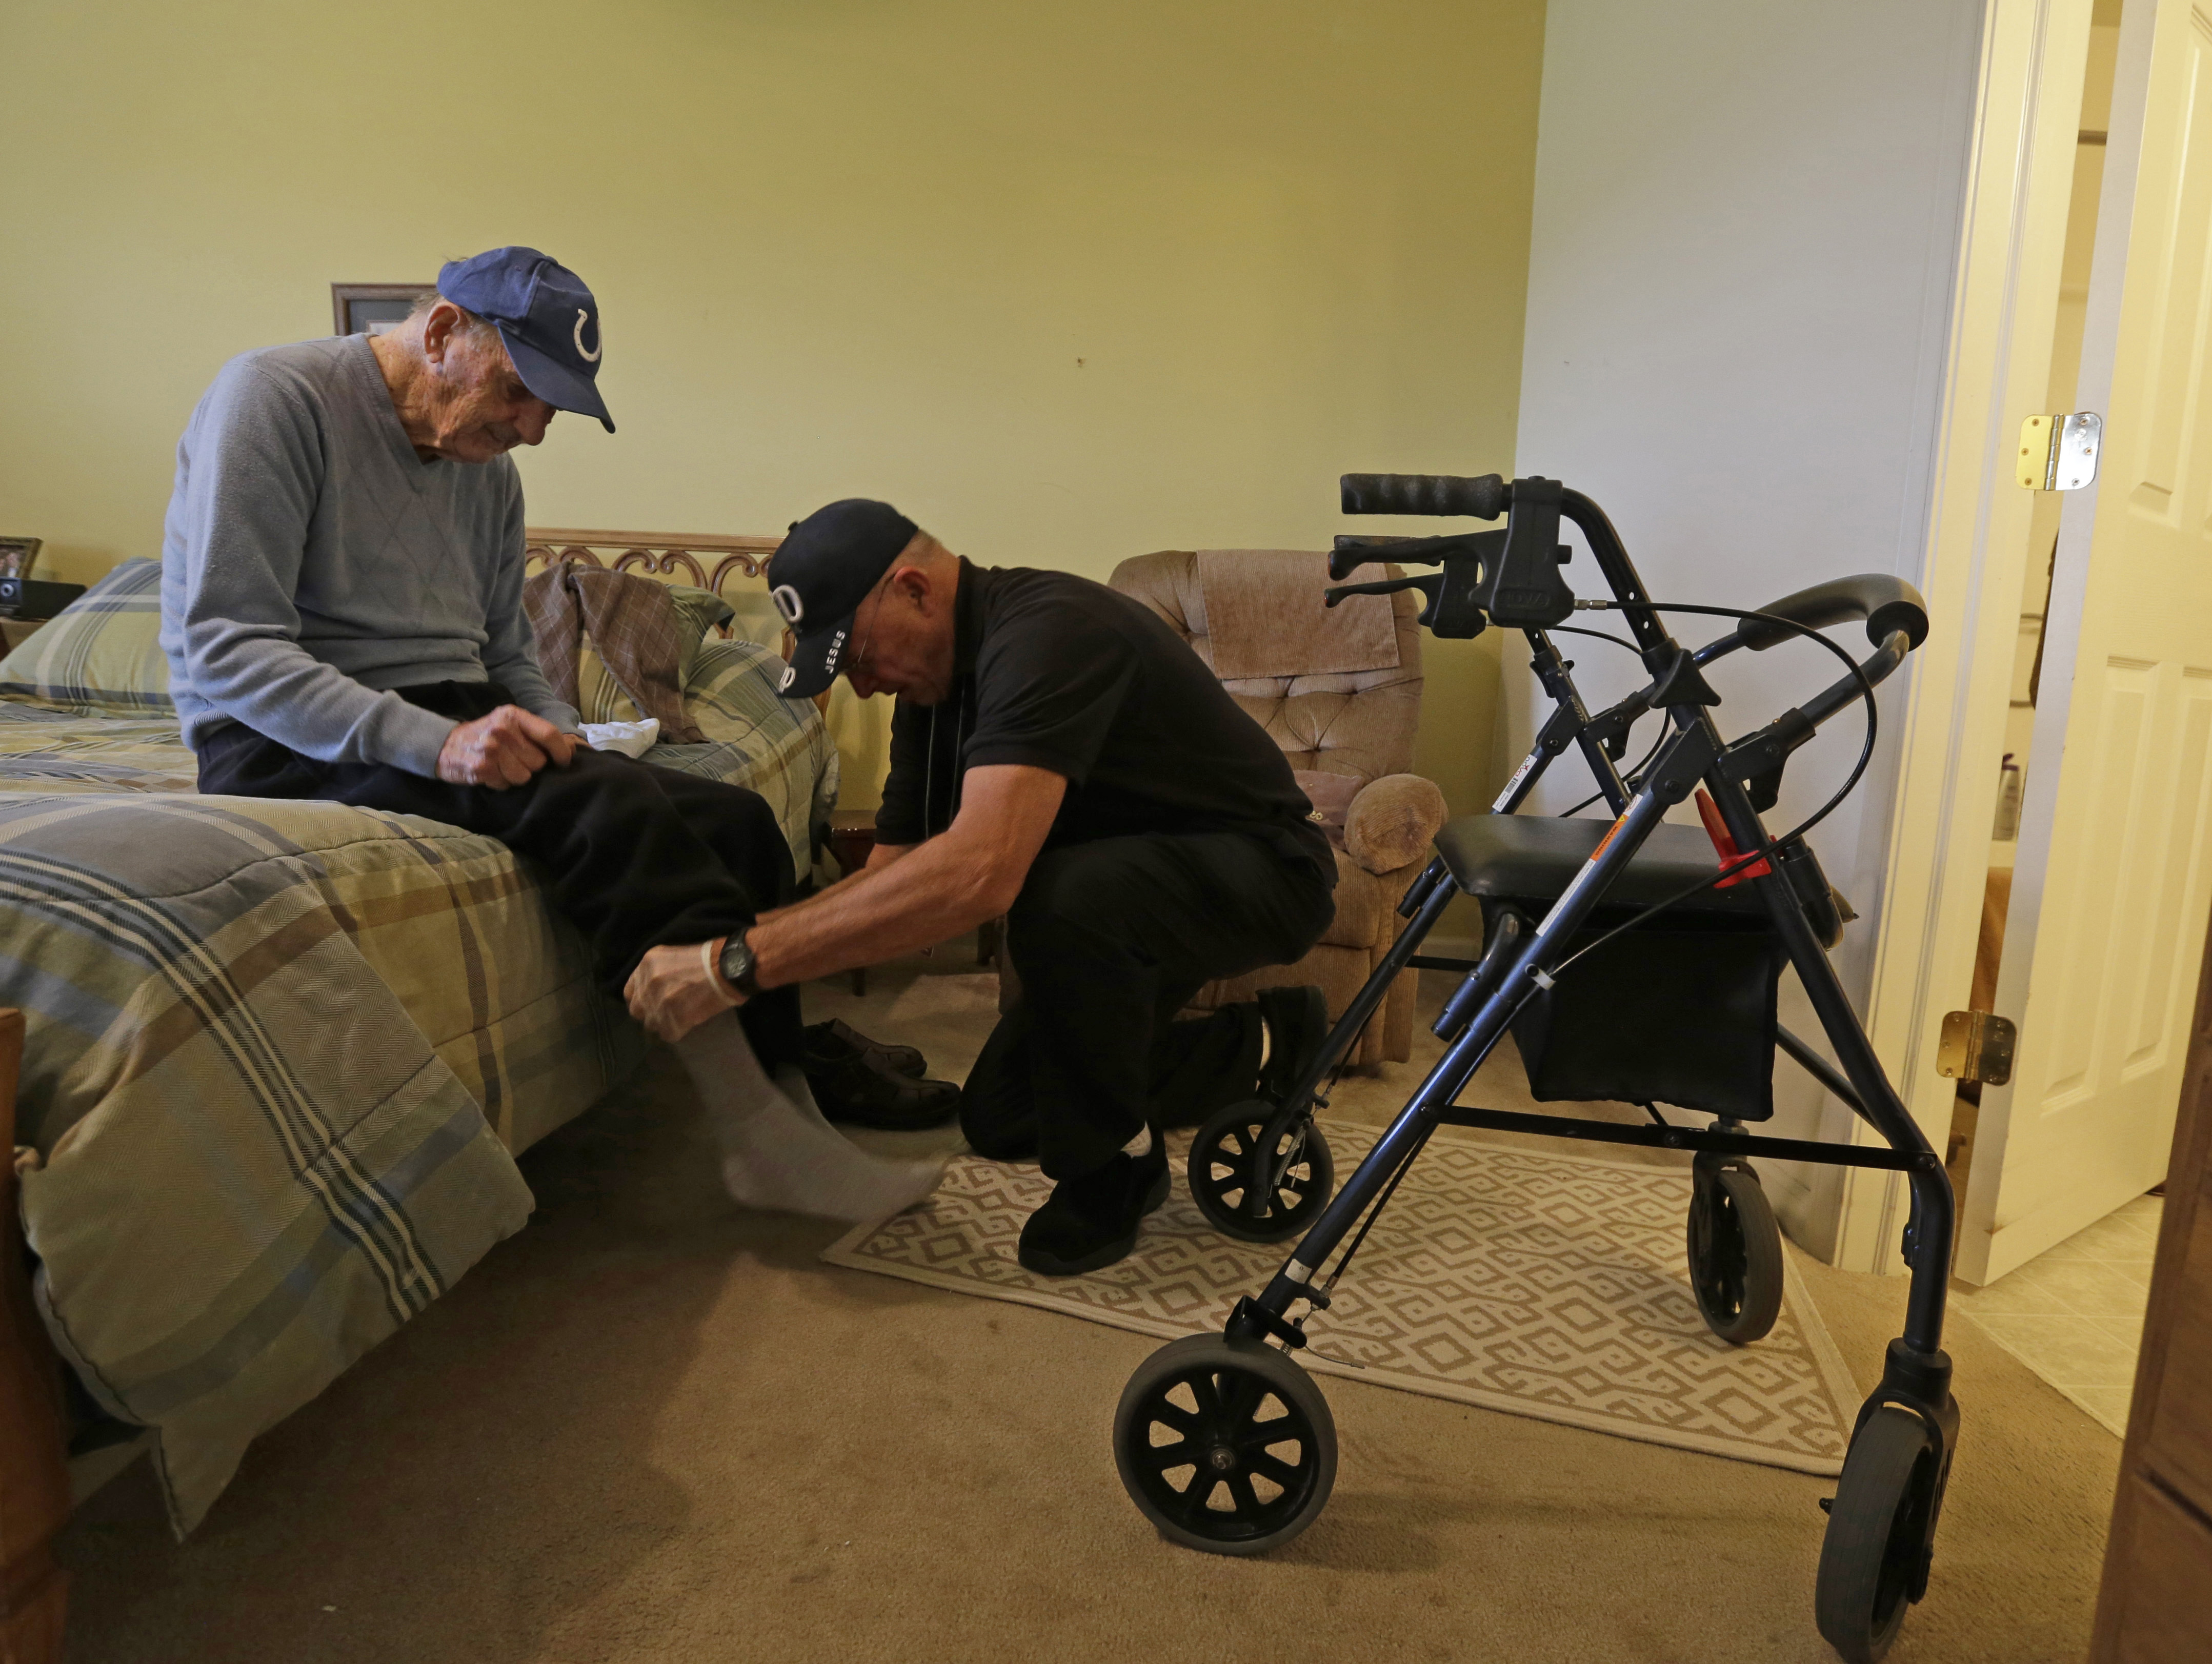
This photo taken Nov. 27, 2013 shows caregiver Warren Manchess helping Paul Gregoline with his shoes and socks, in Noblesville, Ind. As demand for senior services provided by nurses’ aides, home health aides and other such workers grows with the aging of baby boomers, so are those professions' employment of other seniors. (AP Photo/Darron Cummings)
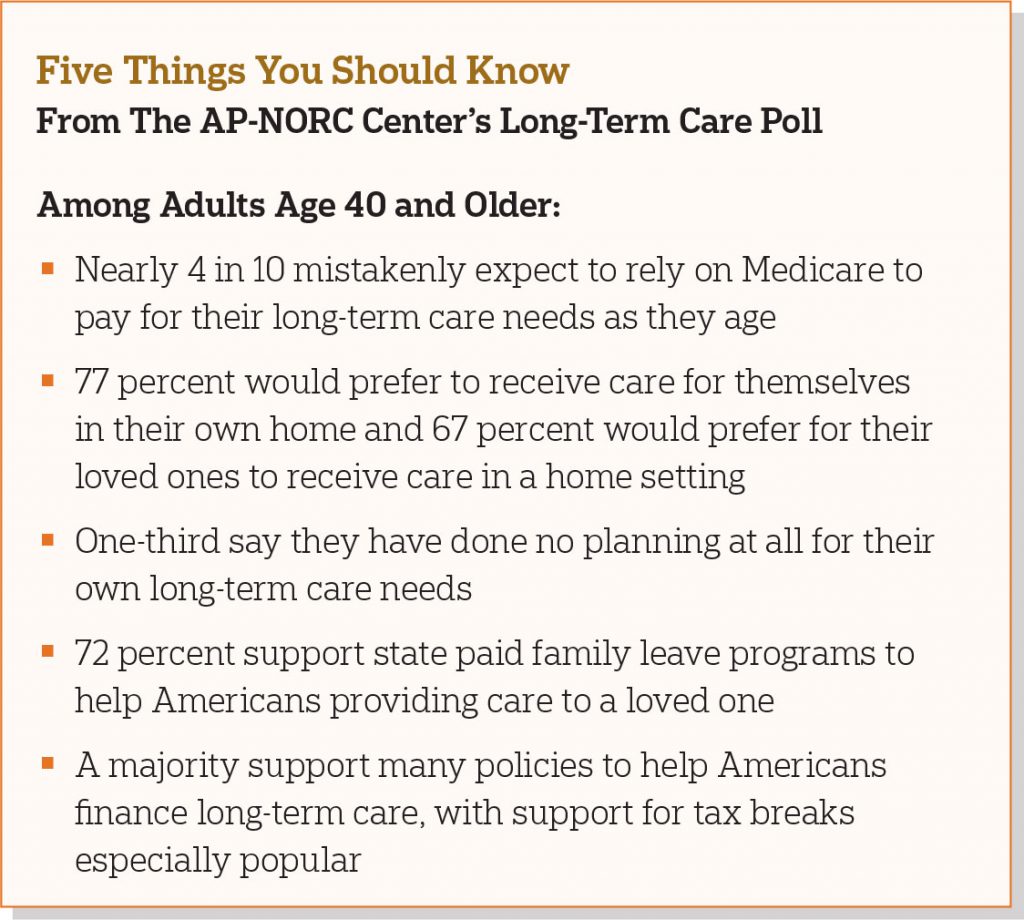
Results from the 2016 Long-Term Care trends poll finds that confidence in the ability to finance long-term care has slightly increased over the past few years yet remains low overall among Americans age 40 and older. The Associated Press-NORC Center for Public Affairs Research survey also finds that many people expect to rely on Medicare and Social Security to pay for their long-term care needs as they age, although these programs generally do not cover most long-term care services or costs. Additionally, support is high for policies that help Americans save for long-term care and for those that defray the costs of caregiving.
In 2013, Americans age 65 or older made up only 14 percent of the national population, but by 2040, it is expected that the senior population will nearly double to comprise about 22 percent.1 The majority of these seniors will require some form of long-term care; that is, help with activities—such as cooking, bathing, or remembering to take medicine—that can be provided in a home or institutional setting.2 As the American population ages, the need for long-term care services and supports to assist seniors with activities of daily living will exponentially increase. How to finance the provision of high-quality services so that the costs are manageable for families and governments will remain a primary challenge.
To help policymakers, health care systems, and families address this issue, research conducted by The AP-NORC Center examines awareness of older Americans’ understanding of the long-term care system, their perceptions and misperceptions regarding the likelihood of needing long-term care services and the cost of those services, and their attitudes and behaviors regarding planning for long-term care.
The 2016 study finds that about half of older Americans support government-administered long-term care insurance programs, and other policies to help Americans prepare for costs of care yield even higher levels of support. Proposed policies to help caregivers face the costs associated with providing long-term care to others, including state programs to provide paid family leave, tax breaks for caregivers, and Social Security earnings credit for caregivers, all enjoy wide support. With regard to paid family leave programs, a majority of those who are employed say they would be very or extremely comfortable asking their employer for time off under such a program to provide care to a loved one with a serious health condition.
While older Americans’ confidence in the ability to pay for long-term care has increased in recent years, misperceptions persist about how people will finance their long-term care, and the proportion of the public planning for future long-term care needs remains low.
When it comes to preferences for where long-term care is provided and by whom, older Americans overwhelmingly say that they would prefer to receive care in their own home, and that they would prefer for that care to be provided by a family member. However, from the caregiver’s perspective that arrangement is not always preferred, as many would rather not travel and instead would like to have their loved one living with them.
Since 2013, The AP-NORC Center has conducted annual surveys to investigate experiences and attitudes regarding long-term care.3,4,5 These surveys revealed that a majority of American adults age 40 and older hold several misperceptions about the extent of the long-term care services that they are likely to need in the future and about the cost of those services. Few older Americans have done substantial planning or saving for their future needs, and less than half have even talked about the topic with their families. A majority support a variety of policy changes that would help in the financing of long-term care, as well as supporting changes in practice that favor a person-centered care approach.
The 2016 survey continues to track items from the previous years while also exploring new topics, including how much people expect to rely on a variety of sources to pay for long-term care needs; preferences and expectations about where people might receive care and who should provide needed care, both for themselves and for family members or friends; support for policy proposals to help prepare for costs of requiring and providing care, including paid family leave policies; and additional questions about long-term care insurance.
To continue contributing new and actionable data to inform policymakers and the public about older Americans’ understanding of and experiences with long-term care, The AP-NORC Center, with funding from The SCAN Foundation, conducted a study including 1,698 telephone interviews with a nationally representative sample of Americans age 40 and older.
Key findings from this study are described below:
- While older Americans’ confidence in their financial preparedness for long-term care remains low overall, there has been a slight increase in public confidence over the past four years consistent with other measures of consumer confidence post-recession.6 In 2013, 27 percent reported feeling very or extremely confident in their ability to pay for long-term care, increasing to 29 percent in 2014, 32 percent in 2015, and 36 percent in 2016.
- When it comes to covering long-term care costs, older Americans with annual household incomes less than $50,000 are more likely to expect to rely on government programs such as Social Security, Medicare, and Medicaid, while those with higher incomes expect to rely more on their personal savings to pay for their care. Still, 3 in 10 of these wealthier older Americans report that they will rely on Medicare to support their care as they age. This reflects common misperceptions among older Americans about the long-term care services that Medicare covers.
- Most Americans age 40 and older (77 percent) would prefer to receive care in their own home, with far fewer preferring to receive care in a senior community (11 percent), a friend or family member’s home (4 percent), or a nursing home (4 percent). Among those who prefer to receive care in a home setting, there are gender differences in preferences for who provides that care: men would prefer to receive care from a spouse (51 percent vs. 33 percent), and women would prefer to receive care from their children (14 percent vs. 35 percent).
- There is widespread support for policies to help caregivers face the costs of providing long-term care, with 72 percent supporting state programs to provide paid family leave, 83 percent supporting tax breaks for caregivers, and 73 percent supporting a Social Security earnings credit for caregivers taking time out from the workforce to provide care.
- As in prior years, long-term care insurance coverage remains low among older Americans, with just 13 percent reporting they are very sure they have this type of private insurance. A majority of those who do have long-term care insurance (69 percent) are somewhat or very satisfied with the cost of the premiums. Among those who do not have long-term care insurance, just 23 percent say they have looked into purchasing long-term care insurance.
- Forty-three percent have either past or current experience providing long-term care to a family member or close friend. Among those with experience as caregivers, 4 in 10 report having to miss work to provide long-term care to a loved one.
- Prior experience with long-term care is associated with greater support for several policies to help people finance long-term care and policies to help alleviate costs for caregivers. Additionally, those with prior long-term care experience express higher levels of concern about aging and are also more likely to anticipate that it is at least somewhat likely that a loved one will need care in the next five years compared to those without experience.
- One-third say they have done no planning at all for their own long-term care needs. This 2016 finding is similar to the 31 percent who said the same in 2015 and remains lower than the 47 percent and 44 percent who said they had done no planning in 2014 and 2013, respectively.
Additional information, including the survey’s complete topline findings, can be found on The AP-NORC Center’s long-term care project website at www.longtermcarepoll.org.
Most Older Americans Lack Confidence In Their Financial Preparedness For Long-Term Care. ꜛ
The majority of Americans age 40 and older continue to lack confidence that they will be able to pay for long-term care, and few expect their current insurance to cover the costs of ongoing living assistance.7 Instead, many older adults expect to turn to Medicare or Social Security to support their care as they age.
Thirty-six percent report they are very or extremely confident they will have the resources to pay for long-term care, while 36 percent are somewhat confident and 24 percent are not too confident or not at all confident. Older Americans’ current beliefs about their financial preparedness for long-term care are similar to 2015, but there has been a slight increase in public confidence in the last three years.
Older Americans in better health and those with higher incomes and more education tend to be more confident, while women and those age 40 to 55 have the least confidence. For example, 45 percent of men express confidence compared with 29 percent of women.
Most say they have not set aside money to pay for long-term care expenses, and even fewer think their current insurance will cover ongoing living assistance services. About 1 in 3 older Americans report they have set aside money for long-term care, a figure that is unchanged from recent years despite the uptick in confidence. Only 24 percent of older adults believe their current insurance will pay for ongoing living assistance, which is a slight decrease from the 31 percent who said the same in 2015.
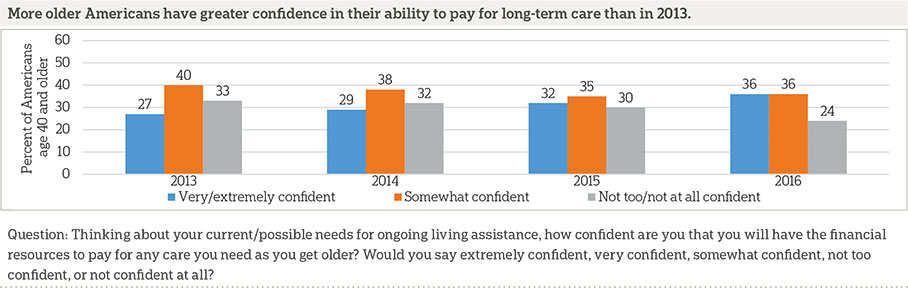
Reflecting A Common Misperception About Long-Term Care Financing, Medicare Tops The List Of Sources People Plan To Rely On To Support Their Care As They Age.ꜛ
When it comes to covering the cost of ongoing living assistance, there is not a single source of support that a majority of older adults expect to rely on as they age. Medicare (38 percent) tops the list of anticipated sources of support, just edging out Social Security (35 percent), even though Medicare does not typically cover most long-term care needs. This finding is consistent with our prior work showing misperceptions among the public about the types of coverage that Medicare provides for ongoing living assistance services. Medicare pays for intermittent stays at a nursing facility but not long-term stays, and it does not generally pay for ongoing care at home by a licensed home health care aide. Yet in 2015, 34 percent believed that Medicare would pay for ongoing care in a nursing home, and another 27 percent were unsure. Similarly, 36 percent of those polled in 2015 thought that Medicare would pay for ongoing care at home by a licensed home health aide, and another 27 percent were unsure.
Just 2 out of 10 older Americans anticipate relying on Medicaid to help finance their care as they age, even though Medicaid, a health care coverage program for low-income people and those with disabilities funded jointly by both state and federal governments, is the largest public payer of long-term care services in the United States.8
The government projects that in the near future out-of-pocket expenses will cover over half of long-term care costs.9 About a third of Americans age 40 and older expect to rely at least quite a bit on personal savings to support their care, and 22 percent say the same about a pension. Although about 2 in 10 expect to rely at least quite a bit on a family member providing care at no cost, less than 1 in 10 expect to rely on either a family member’s future income or savings.
The sources Americans age 40 and older expect to rely on for their care as they get older vary based on income, age, and race and ethnicity.
Older adults with household incomes of less than $50,000 a year are more likely than those with higher incomes to expect to rely on Social Security (47 percent vs. 23 percent), Medicare (47 percent vs. 31 percent), and Medicaid (28 percent vs. 12 percent). In contrast, 20 percent of those with household incomes less than $50,000 a year say they will rely on personal savings compared to 43 percent of those with higher incomes.
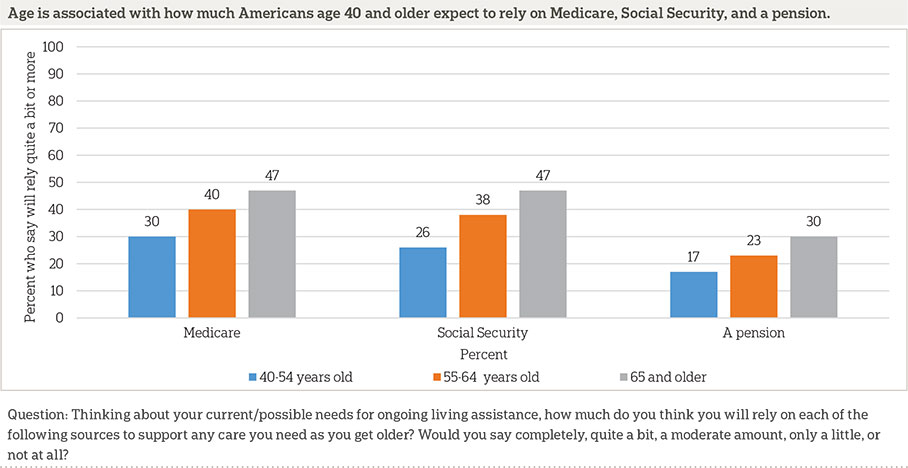
The oldest Americans are most likely to report they will rely quite a bit on Medicare, Social Security, and a pension.
When it comes to relying on Medicaid, which is the country’s largest payer for long-term care services, black Americans age 40 and older are the most likely to cite it as an anticipated source of support. Thirty-nine percent of blacks expect to rely quite a bit on Medicaid compared with 24 percent of Hispanics and 17 percent of whites. These differences by race and ethnicity persist even when holding other demographics like income and education constant.
More Than Half Of Older Americans Say It Is Likely They Will Need Care In The Future, And Most Want To Receive That Care In Their Own Home.ꜛ
The majority of Americans age 40 and older expect they will need care in the future, and most would prefer to receive such care at home. However, some of these adults have doubts about whether they will actually receive care in their preferred location.
The percent of older Americans both receiving long-term care and expecting to need it in the future has remained relatively steady in recent years. About 1 in 10 receive ongoing living assistance, while 5 in 10 say it is at least somewhat likely they will need care in the future, including 2 in 10 who think it is very likely.
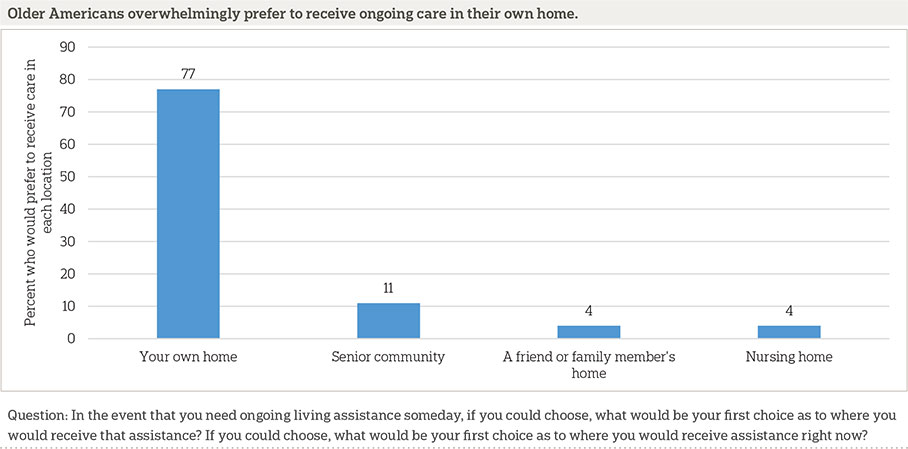
When it comes to care preferences, a majority of older Americans report they would prefer to receive care in their own home (77 percent). Far fewer would prefer to receive care in a senior community (11 percent), a friend or family member’s home (4 percent), or a nursing home (4 percent).
Among the 10 percent of older Americans who have experience receiving care, they, too, prefer that care to happen at home.10 Of the 84 percent of care recipients who received care in their own home, 85 percent say this is their first choice of location. For the remainder, 5 percent say their first choice would be a senior community, and 4 percent would select a nursing home.
Most older Americans do expect they will get care where they want it. Nearly 9 in 10 say it is at least somewhat likely they will receive care in their preferred location, including nearly 6 in 10 who report it is very likely. Only 1 in 10 believe it is not too or not at all likely they will receive care in their preferred location. There is also little difference in people’s expectations based on their preferred location of care. For each preferred location (own home, senior community, family member’s home, or nursing home), at least 8 in 10 are somewhat confident they will receive care in that location.
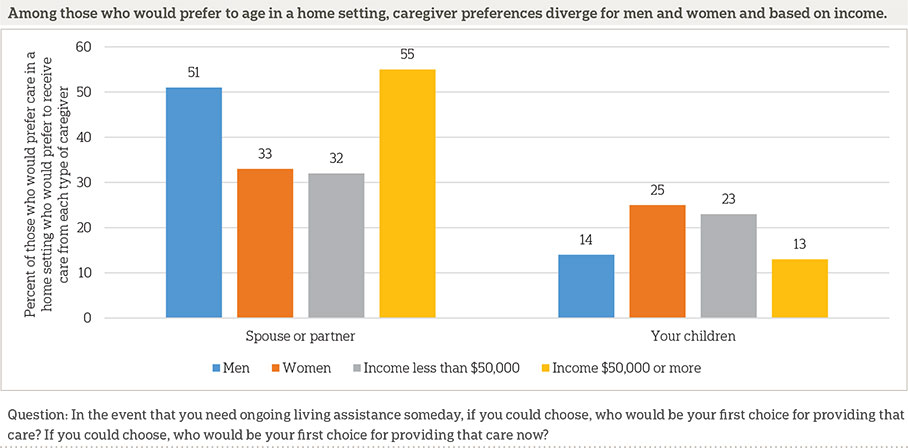
Those with experience receiving care in a home-based setting are most often cared for by family members (52 percent), followed by home health care aides (46 percent), and friends (19 percent). These realities depart slightly from the preferences of older adults generally. When older Americans think about who may provide them with care now or in the future, 7 out of 10 say they would prefer to receive care from family members, including spouses or partners, children, or other relatives. The percentages who say their first choice would be to receive care from a professional home health care aide (22 percent) or a friend (2 percent) are much lower than the percentages of those who have actually received care from those sources.
Caregiver preferences vary based on gender and income. Men are more likely than women to want to receive care from a spouse (51 percent vs. 33 percent) but less likely to prefer care from their children (14 percent vs. 25 percent). Likewise, those with household incomes of $50,000 or higher are more likely than those with lower incomes to prefer care from a spouse (55 percent vs. 32 percent) and less likely to prefer care from their children (13 percent vs. 23 percent). In our 2014 poll, we found that the relationship between the caregiver and receiver influences views of the caregiving experience. Those with experience caring for a spouse or partner were the least likely to say it was a positive life experience. They were also the most likely to say the experience caused stress in the family, was a burden on personal finances, and weakened their personal relationship with the person for whom they cared.
More Than 4 In 10 Americans Age 40 And Older Have Experience Providing Care, And Many Report Having To Miss Work To Do So. ꜛ
Forty-three percent say they are either currently providing ongoing living assistance or have provided it in the past to a family member or close friend. This number has been declining over time, dropping from 53 percent in 2013 and 2014 to 45 percent in 2015, and it has remained low in 2016. Fifteen percent say they are currently providing ongoing living assistance on a regular basis to a family member or close friend. Those who are age 40 to 65 are about twice as likely to say they are providing this type of care as those age 65 and older (17 percent vs. 10 percent).
Among those who have provided care to a family member or friend, either currently or in the past, 4 in 10 say they have had to miss work to do so. This is related to age, since younger caregivers are more likely to be working and thus more likely to say they have had to miss work to provide care. Forty-four percent of caregivers under the age of 65 report missing work, compared to 27 percent of caregivers age 65 and older.
The vast majority of this caregiving is being provided in home settings. Nearly half (47 percent) of those who are providing care say it has been in their own home, and an additional 38 percent say they are providing care in the home of the aging family members or friends who are the recipients of care. Much smaller numbers say they have provided care in another friend or family member’s home, a senior community, or a nursing home.
These actual care locations match up fairly well with older Americans’ general preferences for ideal locations for care. We asked all adults in the survey what would be their first choice of location for care needed by their loved ones. For those currently providing care, we asked where would be their preferred location for that ongoing care. For those not currently providing care, we asked where they would prefer that their loved ones received care in the event that they needed it in the future.
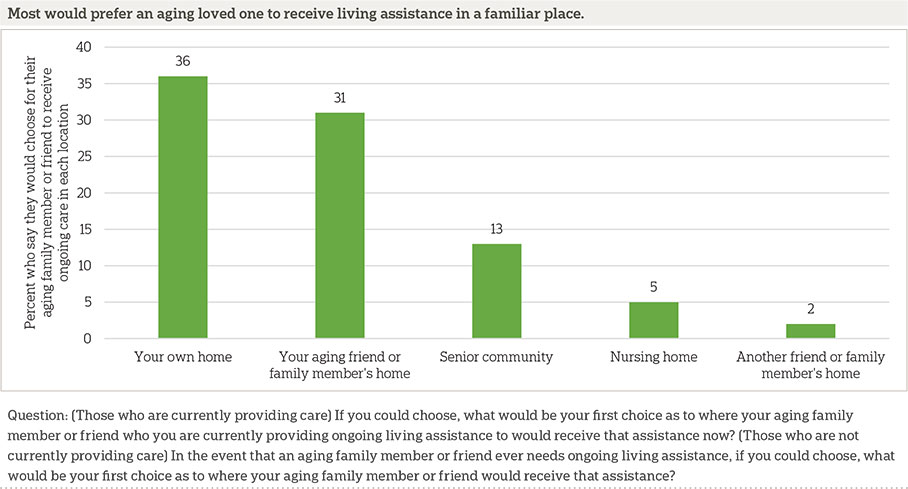
Home locations are popular preferences, with 36 percent saying they would prefer for loved ones to receive care in their own home and 31 percent saying they would prefer that the care be provided in that loved one’s home. Just 13 percent say they would prefer that their loved one receive needed care in a senior community, 5 percent say they would prefer they receive care in a nursing home, and 2 percent say they would prefer that their family member or friend receive care in another person’s home.
Most of those who are currently providing ongoing living assistance in their own home or the home of their loved one say they are providing this care in their preferred location. Eight in 10 long-term care providers who are providing this care in their own home say that is their preferred location. In other words, 20 percent of people providing care in their own homes would prefer that care be provided elsewhere.
Fewer caregivers providing care at their loved one’s home are content with that situation. Fifty-five percent of those who travel to provide care to a loved one in their loved one’s home say that is their preferred location. Thirty percent would prefer to have their loved one at home with them, and 7 percent would prefer to provide care at other locations, such as a senior community, nursing home, or someone else’s home.
Among those who are not currently providing ongoing living assistance, most are optimistic that their aging family member or friend will be able to receive needed care in the respondent’s preferred location.
Older Americans Lack Confidence In Their Ability To Provide Care To A Family Member Or Friend Who May Need It In The Future.ꜛ
Just under half (46 percent) anticipate that it is at least somewhat likely that an aging family member or close friend will need ongoing living assistance in the next five years. Those who have experience with long-term care are more likely to anticipate that their loved one will need assistance, as are those who are younger than 65.
Of those who say their loved one will need ongoing living assistance, 1 in 3 say they will be at least partially responsible for providing that care, and half say that someone else will be responsible for providing that care.
However, these prospective caregivers are not confident that they are prepared to provide this care. Just 30 percent of those who will be responsible say they feel very or extremely prepared to provide this ongoing care to their aging family member or friend, 47 percent say they are somewhat prepared, and 20 percent say they are not very or not at all prepared.
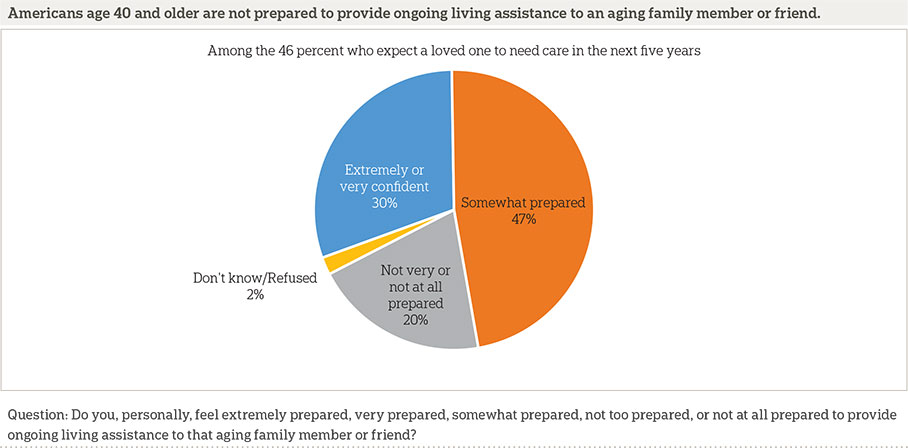
Those with household incomes of less than $50,000 (17 percent) are less likely than those with incomes of $50,000 to $100,000 (41 percent) and incomes of $100,000 or more (46 percent) to say they feel prepared to provide this care. Those with long-term care experience are twice as likely as those without this experience to say they are prepared to provide ongoing living assistance (42 percent vs. 19 percent).
Older Americans Overwhelmingly Support Paid Family Leave, And Many Would Be Willing To Use Such A Program. ꜛ
Currently, the federal government does not require that companies provide employees with paid time off to help care for an aging family member or friend. Three states, California, New Jersey, and Rhode Island, have programs in place to provide partial pay for employees who need to care for a family member with a serious health condition, and recently New York state passed a bill to create a paid family leave program that will take effect in 2018.11,12 Presidential candidates and senators from both political parties have also proposed paid family leave plans at the national level.13,14,15,16,17
Americans age 40 and older are supportive of paid family leave programs, with more than 7 in 10 saying they support a paid family leave program of some sort. Support is similar among those who live in states that already have such a program and those who do not.
Among those working who are not self-employed, more than 6 in 10 say they would be very or extremely comfortable asking their employer for time off under such a program to take care of a family member with a serious health condition. Nearly 2 in 10 say they would be just somewhat comfortable, and just over 1 in 10 say they would be not very or not comfortable at all asking for this time off.
Whites and blacks are both more likely than Hispanics to say they would be comfortable taking advantage of this program (62 percent and 79 percent, respectively, vs. 52 percent).
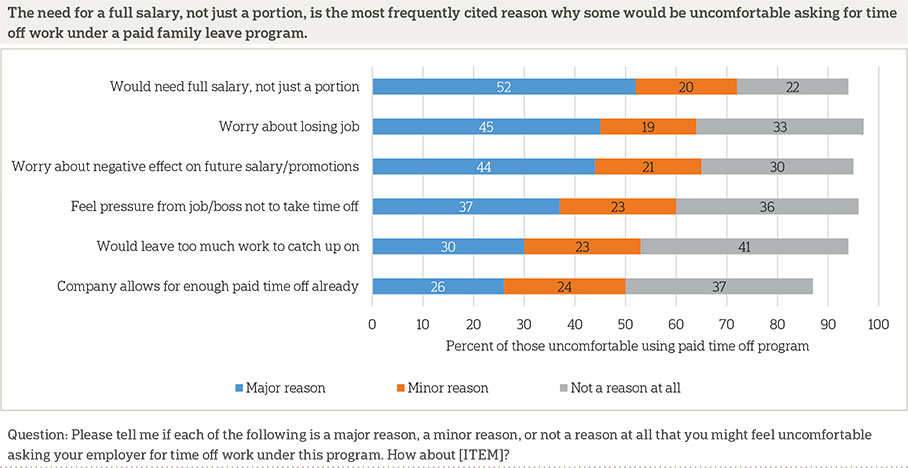
Those who say they would be at least somewhat uncomfortable asking for time off under a paid family leave program most frequently cite the need for a full salary, not just a portion, as a reason for why they feel uncomfortable doing so. Fifty-two percent say it is a major reason, and another 20 percent say it is a minor reason.
Programs To Help Americans With The Costs Of Providing Care Enjoy High Levels Of Support.ꜛ
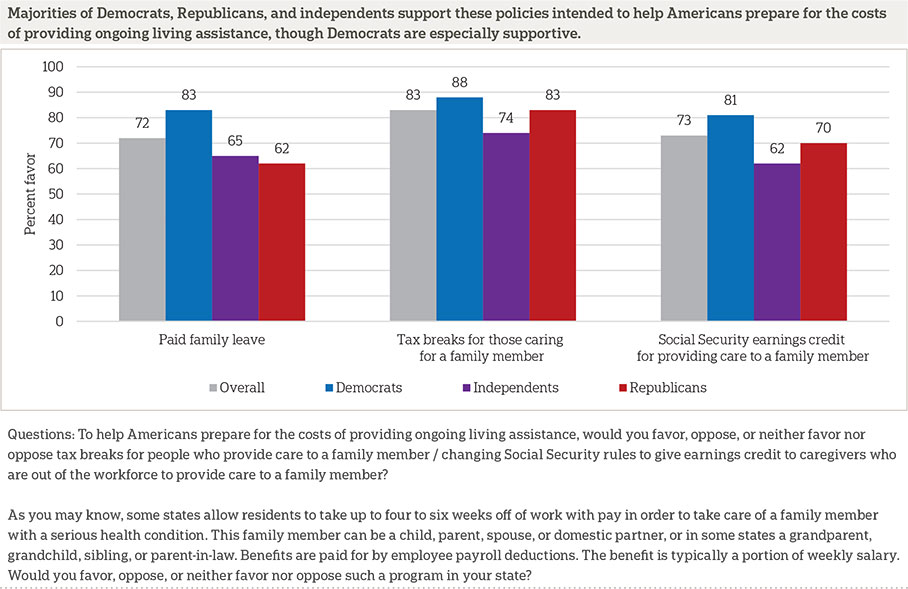
In addition to paid family leave, other programs that enjoy widespread support have been proposed to help Americans with the costs of providing ongoing living assistance.18,19 More than 8 in 10 say they would support tax breaks for people who provide long-term care to a family member. More than 7 in 10 say they support changing Social Security rules to give earnings credit to caregivers who are out of the workforce to provide care to a family member.
Majorities of Democrats, independents, and Republicans support all three of these programs, but there are differences in the degree of support between the parties. Democrats are more likely than independents and Republicans to say they support paid family leave (83 percent vs. 65 percent and 62 percent, respectively) and Social Security earnings credit for caregivers out of the workforce (81 percent vs. 62 percent and 70 percent, respectively) . No party differences emerge for supporting tax breaks for those caring for a family member.
Though a majority of Americans age 65 and older support all three of these programs to help people handle the costs of long-term care, they are less likely to support them than those age 40 to 64. Eighty-six percent of those age 40 to 64 favor tax breaks for people who provide care to a family member compared to 77 percent of those age 65 and older. Seventy-six percent of those age 40 to 64 favor changing Social Security rules to give earnings credit to caregivers compared to 65 percent of those age 65 and older. And, 77 percent of Americans age 40 to 64 say they would support a paid family leave program compared to 59 percent of those age 65 and older.
Experience with long-term care, either as a caregiver, a recipient of care, or by employing someone to provide care, is associated with support for policies to help people prepare for the costs of providing care. Those with experience with long-term care are more likely than those without experience to favor both tax breaks for those who provide care to a family member (87 percent vs. 79 percent) and giving earnings credit to caregivers (78 percent vs. 68 percent).
Gender differences emerge in support of paid family leave, with women being more supportive than men (76 percent vs. 66 percent).
About Half Of Older Americans Support Government-Administered Long-Term Care Insurance Programs, And Other Policies To Help Americans Prepare For Costs Of Care Garner Even Higher Levels Of Support.ꜛ
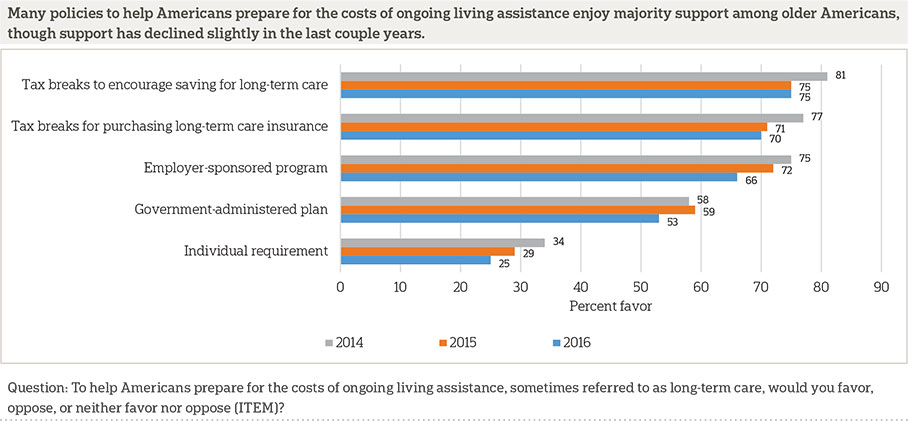
Several policies to help Americans prepare for the costs of ongoing living assistance enjoy majority support in 2016, though support for a few of them has declined compared to 2014 or 2015.
The two most widely supported programs in 2016 feature tax incentives to help address the costs of care. Seventy-five percent support tax breaks to encourage savings for long-term care. Support for this proposal has declined from 81 percent in 2014 but remains flat compared to 2015.
Seventy percent favor tax breaks for purchasing long-term care insurance, similar to the 71 percent who favored such a program in 2015. However, this is a decline compared to 2014 (77 percent).
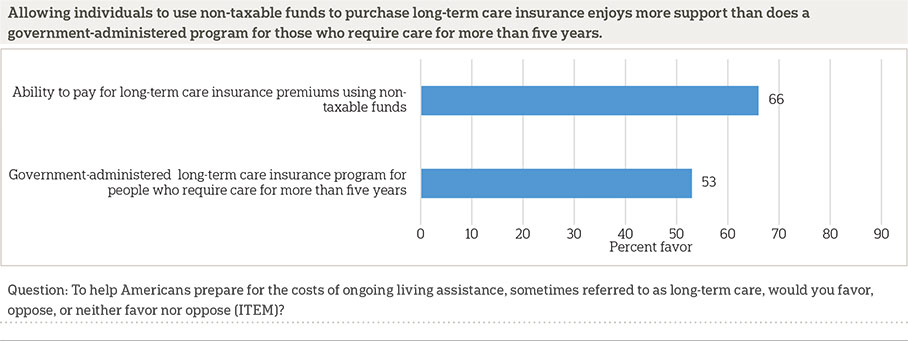
Another popular program in 2016 is allowing individuals to use non-taxable funds such as IRAs or 401(k)s to pay for long-term care insurance premiums. Two-thirds say they support such a policy. This policy was not asked about in prior years.
Two-thirds also support the ability for individuals to purchase long-term care insurance through their employer that is portable if they leave their job, similar to COBRA insurance, though this represents a decline since 2015 when 72 percent said they support this policy.
Support for a government-administered long-term care insurance program similar to Medicare trended upward between 2013 and 2015, increasing from 51 percent to 59 percent, but support has declined to 53 percent in 2016. Similarly, 53 percent say they would support a government-administered long-term care insurance program for people who need care for more than five years, which is a longer period of time than is typically covered by private long-term care insurance. This policy was not asked about in past years.
Support for a requirement that individuals purchase private long-term care insurance declined between 2014 and 2015 but remains at 2015 levels in 2016. Just 25 percent say they support such a policy, and it remains the least popular program of those asked about.
As in previous iterations of this survey, support for some of these policies varies by party identification. Questions about two different policies show that Democrats are significantly more likely than Republicans or independents to favor the government directly administering long-term care insurance. Seventy-one percent of Democrats but just 36 percent of Republicans and 44 percent of independents favor a proposal to create a government-administered long-term care insurance program similar to Medicare. Similar numbers (72 percent of Democrats, 36 percent of Republicans, and 44 percent of independents) support a government-administered insurance program that would cover people who require care for more than five years, which is longer than a typical private insurance plan covers long-term care. Additionally, Democrats (35 percent) are more likely than Republicans (17 percent) or independents (19 percent) to favor a requirement that individuals purchase long-term care insurance.
Democrats and Republicans agree on some proposals to help Americans prepare for the costs of long-term care, though. Eighty percent of Democrats and 78 percent of Republicans favor tax breaks to encourage saving for long-term care expenses. Similarly, 76 percent of Democrats and 70 percent of Republicans favor tax breaks for people who purchase long-term care insurance. Seventy-one percent of both parties favor allowing individuals to purchase long-term care insurance through their employer that is portable, similar to COBRA, and 68 percent of Democrats and 71 percent of Republicans favor allowing individuals to use non-taxable funds like IRAs or 401(k)s to pay for long-term care insurance premiums.
For the new policy proposal asked about in 2016 concerning a government-administered long-term care insurance program for people who require care for more than five years, additional demographic differences emerge. Those with experience providing or receiving long-term care are more likely than those without experience to support a government-administered insurance program for people who require care for more than five years (58 percent vs. 49 percent). Those age 40-64 are more likely to support this program compared to those age 65 and older (58 percent vs. 43 percent).
Income differences are associated with support for allowing non-taxable funds to be used to pay for long-term care insurance premiums, with 77 percent of those earning $50,000 to $100,000 a year and 85 percent of those earning over $100,000 a year favoring such a proposal compared to just 60 percent of those earning less than $50,000 a year.
Additionally, those who report excellent or very good health (73 percent) or good health (68 percent) are more likely than those who report fair or poor health (54 percent) to favor allowing non-taxable funds to be used to pay for long-term care insurance.
Few Older Americans Currently Have Long-Term Care Insurance From A Private Insurance Company, And A Majority Of Those Who Do Not Have It Have Not Looked Into It.ꜛ
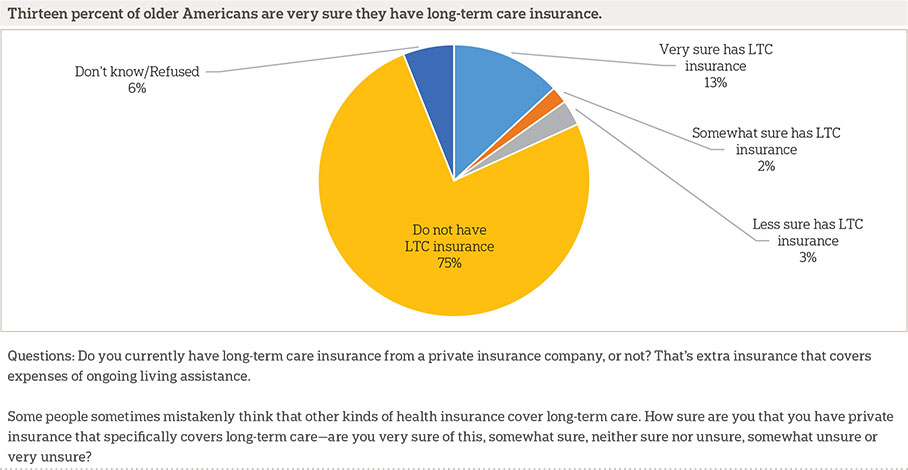
As in recent years, few older Americans report having long-term care insurance from a private company. Twenty percent report they have it, and three-quarters say they do not. When asked about their certainty about having an insurance plan that specifically covers long-term care needs, over a quarter of those who say they have long-term care insurance say they are somewhat sure or not sure. The number reporting that they have long-term care insurance has changed very little in the past four years; 21 percent reported having such coverage in 2013, 17 percent reported coverage in 2014, and 17 percent reported coverage in 2015.
Those who do have it are generally satisfied with the cost of the premiums; 69 percent say they are somewhat or very satisfied compared to just 16 percent who say they are somewhat or very unsatisfied. Eleven percent are neither satisfied nor unsatisfied.
Among those who do not have long-term care insurance, very few have even looked into buying it. Just 23 percent say they have done so.
Education and income are both associated with the likelihood of having long-term care insurance from a private company. Just 13 percent of those with no more than a high school degree say they have long-term care insurance compared to 25 percent of those with more educational attainment. Just 12 percent of those with household income less than $50,000 say the same compared to 20 percent of those earning between $50,000 to $100,000 and 30 percent of those earning $100,000 or more.
Long-term care insurance is not a part of the plan for most older Americans as they prepare for the possibility of ongoing living assistance. Fifty percent say they will not rely on long-term care insurance at all to support the care they need as they grow older. Just 30 percent say they will rely on it a moderate amount or more. Americans age 65 and older are more likely to say it will not be a part of supporting their ongoing living assistance needs than those age 40 to 65.
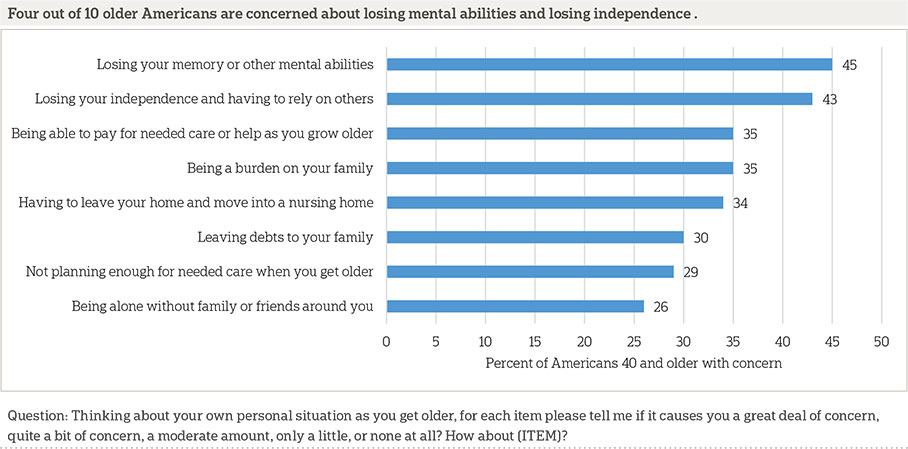
When It Comes To Concerns About Aging, Those Over 40 Are Most Worried About Losing Their Memory And Other Mental Abilities And Losing Their Independence.ꜛ
Just under half of Americans 40 and older say they have quite a bit or a great deal of concern about losing their memory or other mental abilities as they get older. A similar 43 percent say they are concerned about losing their independence and having to rely on others.
While these two concerns have consistently been the most commonly mentioned over the past four years, concern levels over nearly all issues have gradually declined during this period of time. These declines have been fairly consistent among all potential concerns respondents were asked about, which means the relative importance given to each concern by respondents has remained mostly consistent from year to year.
As has been the case in previous years, levels of concern for each item increase among those who have personal experience with long-term care compared to those who do not have experience with long-term care for themselves, family members, or friends. Also consistent with previous years’ findings, age impacts levels of concern, with those 40 to 54 consistently expressing greater concern on these measures than respondents who are 65 or older.
Reports Of Planning For Long-Term Care Needs Remain Low, Similar To 2015 Findings.ꜛ
One-third of those 40 or older say they have done no planning at all for their own long-term care needs. This 2016 finding is similar to the 31 percent who said the same in 2015 and remains lower than the 47 percent and 45 percent who said they had done no planning in 2014 and 2013, respectively.
When asked about specific actions they may have taken to plan for their care needs in the future, two-thirds say they have discussed preferences for funeral arrangements with someone they trust, and over half say they have created a legal document such as a living will or advanced treatment directive. Just under half (47 percent) have discussed their preferences for ongoing living assistance with their family, which is up slightly from the 41 percent in 2013 and 2014 and 42 percent in 2015 who reported taking this action.
Less common actions include setting aside money to pay for ongoing living assistance expenses (35 percent), modifying their home to make it easier to live in as they grow older (28 percent), looking into long-term care insurance (27 percent), and looking for information about aging issues and ongoing living assistance (26 percent).
Less than 10 percent say they have moved or made plans to either move to a community designed for older adults or move in with a family member or friend.
Those With Experiences With Person-Centered Care Practices Continue To Say Those Practices Have Improved Care.ꜛ
The 2015 survey introduced a new series of questions on “person-centered care,” an approach to health care and supportive services that allows individuals to take control of their own care by specifying preferences and outlining goals that will improve their quality of life.20,21
This year’s survey again asked about two specific aspects of person-centered care: having a single care manager who serves as a point of contact and can coordinate all aspects of care, and having an individualized care plan designed to take into account the patient’s personal goals and preferences. Those who regularly receive care from two or more doctors as part of their own long-term care or the care of loved ones say that their doctors engage in these person-centered care practices.
In 2016, two-thirds of those with current long-term care experience, as either a recipient or provider, and who regularly receive care from two or more doctors have a single care manager who serves as a point of contact and coordinates all aspects of their care. A majority (64 percent) of those currently experiencing long-term care who have two or more doctors say there is an individualized care plan designed to take into account personal goals and preferences.
As in 2015, the vast majority of people who receive person-centered care think it improves their care, but those who do not receive these services are unsure about their value. Those who do have a single care manager generally feel this has improved their care, 52 percent say this has improved their care a lot, and an additional 29 percent say this has improved their care a little. Of those who say they do not have a single care manager, 46 percent believe it would improve their care a lot, and an additional 22 percent say it would improve their care a little. Those with an individualized care plan say this has improved care, 64 percent say this has improved care a lot, and an additional 30 percent say this has improved care a little. Of those who say they do not have an individualized care plan, 20 percent believe it would improve their care a lot, and an additional 35 percent say it would improve their care a little.
About the Studyꜛ
Survey Methodology
This study, funded by The SCAN Foundation, was conducted by The Associated Press-NORC Center for Public Affairs Research. Interviews were conducted by Interviewing Services of America between the dates of February 18 and April 9, 2016. Staff from NORC at the University of Chicago, The Associated Press, and The SCAN Foundation collaborated on all aspects of the study.
This survey of the 50 states and the District of Columbia was conducted via telephone with 1,698 adults age 40 and older. The sample included 1,117 respondents on landlines and 581 respondents on cell phones. The sample also included an oversample of Californians 40 years and older. The sample includes 526 residents of California age 40 and older. In addition, the sample included an oversample of Hispanics 40 years and older. The sample includes 400 Hispanics age 40 and older.
Respondents on landline phones were selected randomly within households. For households with two eligible adults age 40 and older, one respondent was selected randomly by the computer-assisted telephone interviewing system. For households with three adults or more age 40 and older, the respondent who most recently celebrated a birthday at the time of the call was selected. If the selected respondent was not available at the time of the call, interviewers were trained to set up a time to call back to speak with that respondent. Interviews were conducted in both English and Spanish, depending on respondent preference. All interviews were completed by professional interviewers who were carefully trained on the specific survey for this study.
The random digit dial sample, including the California oversample, was provided by a third-party vendor, Scientific Telephone Samples. The final response rate for the overall sample was 37 percent, based on the American Association of Public Opinion Research Response Rate 3 Method. Additionally, the final response rate for the California sample was 40 percent, and the final response rate for the Hispanic sample was 15 percent.
The sampling frame utilizes the standard dual telephone frames (landline and cell), with an oversample of numbers from the state of California, and a supplemental sample of both landline and cell numbers targeting households with Hispanic adults. The targeted sample was provided by Scientific Telephone Samples and Marketing Systems Group and was pulled from a number of different commercial consumer databases and demographic data.
Sampling weights were calculated to adjust for sample design aspects (such as unequal probabilities of within household selection) and for nonresponse bias arising from differential response rates across various demographic groups. Poststratification variables included age, sex, race, region, education, and landline/cell phone use. The weighted data, which thus reflect the U.S. population, were used for all analyses. The overall margin of sampling error was +/- 3.4 percentage points, adjusted for design effect resulting from the complex sample design. The California sample’s margin of sampling error was +/- 5.5 percentage points, and the Hispanic sample’s margin of sampling error was +/- 6.7 percentage points, both also adjusted for design effect resulting from the complex sample design.
All analyses were conducted using STATA (version 14), which allows for adjustment of standard errors for complex sample designs. All differences reported between subgroups of the U.S. population are at the 95 percent level of statistical significance, meaning that there is only a 5 percent (or less) probability that the observed differences could be attributed to chance variation in sampling. Additionally, bivariate differences between subgroups are only reported when they also remain robust in a multivariate model controlling for other demographic, political, and socioeconomic covariates.
A comprehensive listing of all study questions, complete with tabulations of top-level results for each question, is available on The AP-NORC Center for Public Affairs Research long-term care website: www.longtermcarepoll.org.
Contributing Researchers
From NORC at the University of Chicago
Jennifer Benz
Jennifer Titus
Dan Malato
Alejandra Cancino
Trevor Tompson
Becky Reimer
Emily Alvarez
David Sterrett
Brian Kirchhoff
Wei Zeng
Jason Rajan
From The Associated Press
Emily Swanson
About the Associated Press-NORC Center for Public Affairs Research
The AP-NORC Center for Public Affairs Research taps into the power of social science research and the highest-quality journalism to bring key information to people across the nation and throughout the world.
- The Associated Press (AP) is the world’s essential news organization, bringing fast, unbiased news to all media platforms and formats.
- NORC at the University of Chicago is one of the oldest and most respected, independent research institutions in the world.
The two organizations have established The AP-NORC Center for Public Affairs Research to conduct, analyze, and distribute social science research in the public interest on newsworthy topics, and to use the power of journalism to tell the stories that research reveals.
The founding principles of The AP-NORC Center include a mandate to carefully preserve and protect the scientific integrity and objectivity of NORC and the journalistic independence of AP. All work conducted by the Center conforms to the highest levels of scientific integrity to prevent any real or perceived bias in the research. All of the work of the Center is subject to review by its advisory committee to help ensure it meets these standards. The Center will publicize the results of all studies and make all datasets and study documentation available to scholars and the public.
The complete topline data are available at www.longtermcarepoll.org.
Footnotesꜛ
1. Administration on Aging. 2014. A Profile of Older Americans: 2014. https://www.acl.gov/sites/default/files/Aging%20and%20Disability%20in%20America/2014-Profile.pdf ꜛ
2. U.S. Department of Health and Human Services. 2015. National Clearinghouse for Long-Term Care Information. http://longtermcare.gov/the-basics/ꜛ
3. AP-NORC Center for Public Affairs Research. 2013. Long-Term Care: Perceptions, Experiences, and Attitudes among Americans 40 or Older. https://www.longtermcarepoll.org/Pages/Polls/Long-Term-Care-2013.aspxꜛ
4. AP-NORC Center for Public Affairs Research. 2014. Long-Term Care in America: Expectations and Reality. https://www.longtermcarepoll.org/Pages/Polls/Long-Term-Care-2014.aspxꜛ
5. AP-NORC Center for Public Affairs Research. 2015. Long-Term Care in America: Americans’ Outlook and Planning for Future Care. https://www.longtermcarepoll.org/Pages/Polls/long-term-care-in-america-americans-outlook-and-planning-for-future.aspxꜛ
6. Consumer Confidence Index®.ꜛ
7. For the purpose of the survey, the phrase “ongoing living assistance” was used in place of long-term care and was defined as “…help with things like keeping house, cooking, bathing, getting dressed, getting around, paying bills, remembering to take medicine, or just having someone check in to see that everything is okay. This help can happen at your own home, in a family member’s home, in a nursing home, or in a senior community. And, it can be provided by a family member, a friend, a volunteer, or a health care professional.”ꜛ
8. Kaiser Commission on Medicaid and the Uninsured. 2015. Medicaid and Long-Term Services and Supports: A Primer. http://kff.org/medicaid/report/medicaid-and-long-term-services-and-supports-a-primerꜛ
9. Office of the Assistant Secretary for Planning and Evaluation (ASPE). 2015. Long-term services and supports for older Americans: Risks and financing research brief. ASPE Issue Brief. https://aspe.hhs.gov/basic-report/long-term-services-and-supports-older-americans-risks-and-financing-research-briefꜛ
10. Those living in senior communities and nursing homes without direct phone lines in residents’ rooms would not have been included in the landline telephone sample.ꜛ
11. Kaiser Family Foundation. 2014. Balancing on shaky ground: Women, work, and family health. Data Note. http://files.kff.org/attachment/balancing-on-shaky-ground-women-work-and-family-health-data-noteꜛ
12. National Partnership for Women and Families. 2016. State Paid Family Leave Insurance Laws. http://www.nationalpartnership.org/research-library/work-family/paid-leave/state-paid-family-leave-laws.pdfꜛ
13. Hillary for America. 2016. Paid Family and Medical Leave: It’s Time to Guarantee Paid Family and Medical Leave in America. https://www.hillaryclinton.com/issues/paid-leave/ꜛ
14. Bernie 2016. 2016. Issues: Real Family Values. https://berniesanders.com/issues/real-family-values/ꜛ
16. http://www.king.senate.gov/download/?id=47B89267-C4AA-4C33-889B-995761622661&inline=fileꜛ
17. http://www.gillibrand.senate.gov/issues/paid-family-medical-leaveꜛ
18. Hillary for America. 2016. Hillary Clinton’s Plan to Invest in the Caring Economy: Recognizing the Value of Family Caregivers and Home Care Workers. https://www.hillaryclinton.com/briefing/factsheets/2015/11/22/caring-economy/ꜛ
19. Bernie 2016. 2016. Strengthen and Expand Social Security. https://berniesanders.com/issues/strengthen-and-expand-social-security/ꜛ
20. AP-NORC Center for Public Affairs Research. 2015. Long-Term Care in America: Americans’ Outlook and Planning for Future Care. https://www.longtermcarepoll.org/Pages/Polls/long-term-care-in-america-americans-outlook-and-planning-for-future.aspxꜛ
21. AP-NORC Center for Public Affairs Research. 2015. Video Interactive: Solving the Person-Centered Care Puzzle. http://interactives.ap.org/2015/person-centered-care/ꜛ