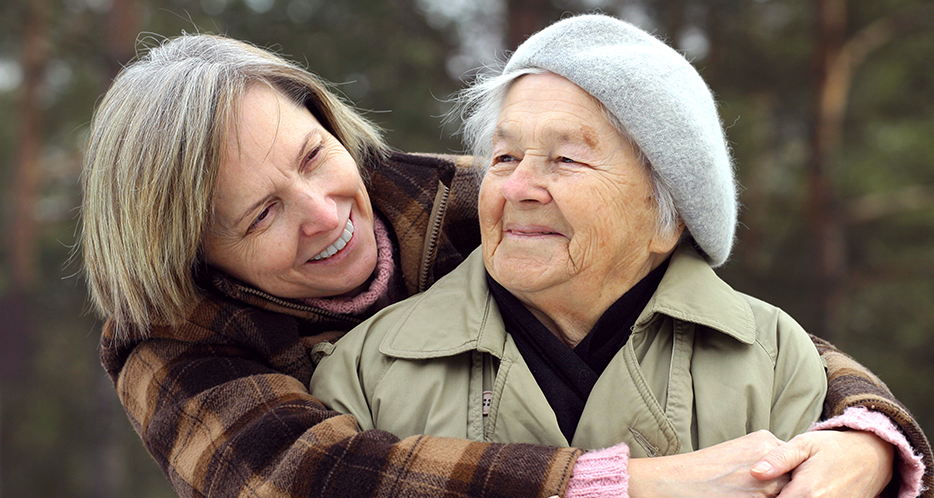
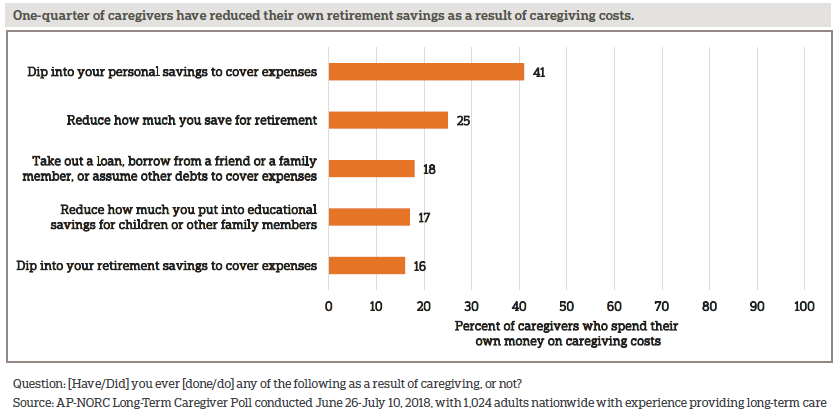
As family and friends take on more of the responsibility of caring for the nation’s growing senior population, their own personal and professional lives often pay the price, according to a new study from The Associated Press-NORC Center for Public Affairs Research. For about one-quarter of America’s informal caregivers, the amount of time they spend providing care each week is the equivalent of a full-time job. Beyond the hours they spend caregiving, 8 in 10 pay for caregiving costs out of their own pockets, with 13 percent spending $500 or more a month. For the majority of caregivers with incomes of less than $50,000, these costs impose a significant burden. Forty-three percent of these caregivers have dipped into their personal savings, and 23 percent have reduced how much they save for their own retirement, suggesting that the financial impacts of informal caregiving are significant and long lasting.
Currently, 40 percent of Americans have experience providing long-term care to an older family member or friend. The need for long-term care services is expected to increase dramatically over the coming decades, as the U.S. population of adults age 65 and older is projected to nearly double,1 so understanding the full range of impacts caregivers face is of critical importance.
The AP-NORC Center survey finds that many who take on a caregiving role face significant health challenges themselves. Fully 39 percent of caregivers have a health condition, physical limitation, or mental health condition that affects their daily life or limits their own activities, and 40 percent of this group say that providing care makes it harder to manage their own health. In addition, a majority of caregivers report having less free time or less time for socializing with friends, and nearly half of caregivers who work have used their vacation time to provide care.
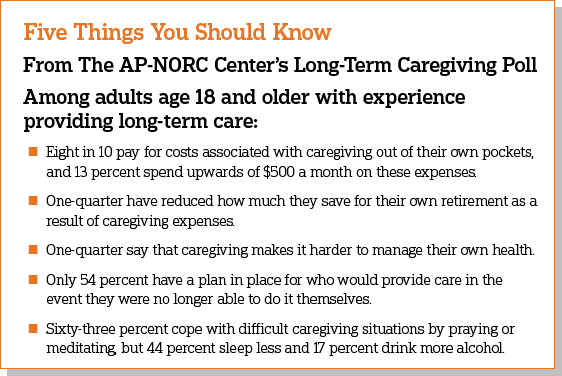
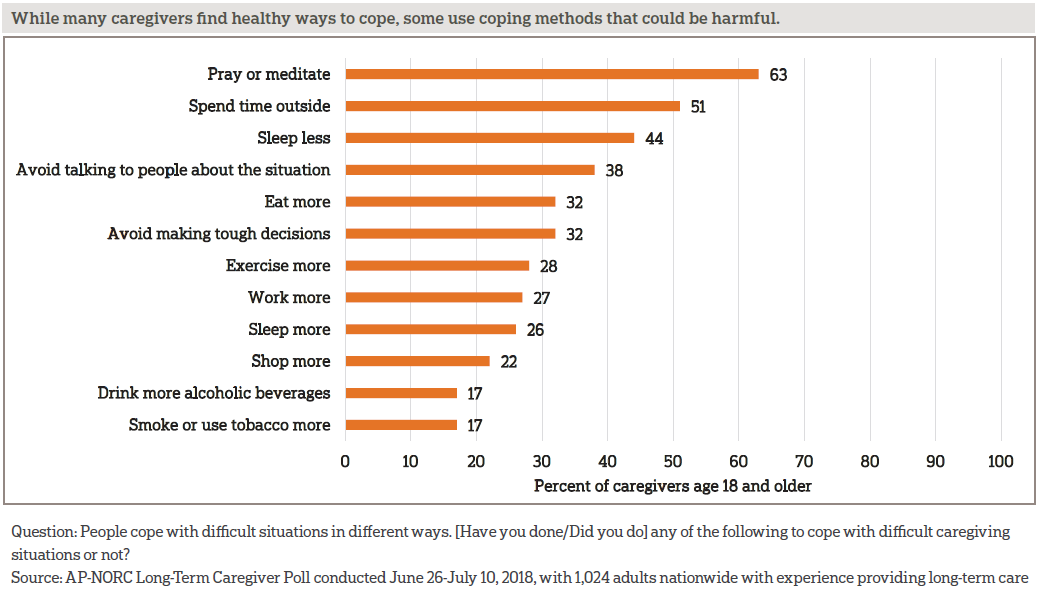
Despite these challenges, a majority of informal caregivers view their role as an important if not essential part of their personal identity, and most find healthy ways to cope with the stresses of providing long-term care. Sixty-three percent pray or meditate, and 51 percent spend time outside. However, some caregivers employ such unhealthy behaviors as sleeping less (44 percent), avoiding talking to people about the situation (38 percent), drinking more alcohol (17 percent), or smoking or using tobacco more (17 percent).
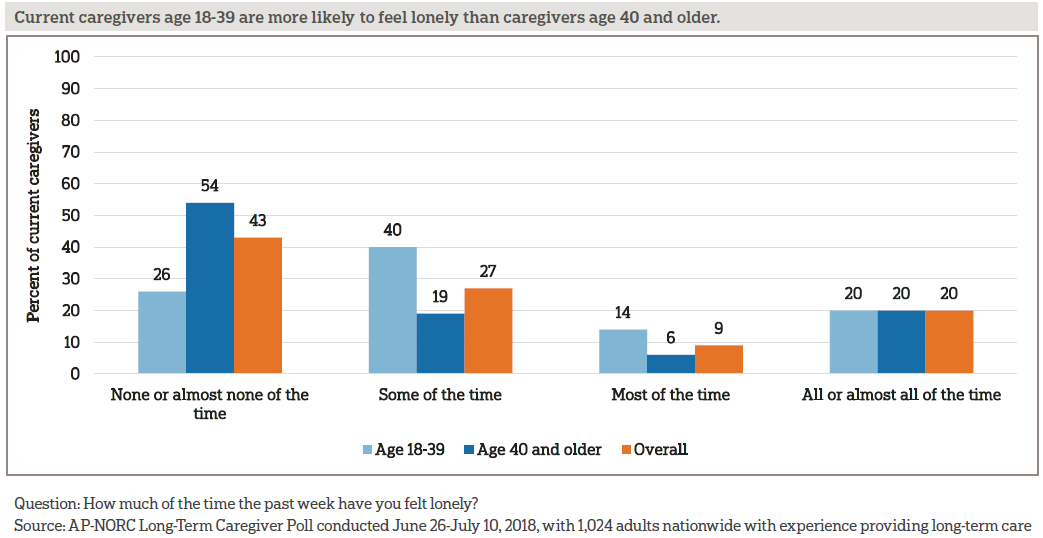
More than half of current caregivers feel lonely at least some of the time. Age is a strong factor in these feelings. Those age 18-39 are much more likely to report feeling lonely compared to caregivers age 40 and older (74 percent vs. 46 percent). This age difference is in line with a prior AP-NORC poll finding that, although those under 40 spend less time providing care, they are more likely than older caregivers to report being stressed by caregiving.2
The majority of Americans age 65 and older will require at least some long-term care services and supports as they age, often as a result of chronic illness or disability.3 Three-quarters of caregivers provide assistance with daily activities like grocery shopping, housekeeping, providing transportation to appointments, or preparing meals. In addition to household assistance, the survey finds that a majority of caregivers provide support with medicine or health monitoring, and nearly half provide actual medical care, such as changing bandages or administering injections. Family members and friends, who are mostly unpaid, provide much of the long-term care their loved ones and neighbors require to remain at home in the community as they age. This survey focuses on the perspectives of these informal caregivers. It is a follow up to the sixth annual Long-Term Care Trend Survey,4 completed in April 2018.
Since 2013, The AP-NORC Center has conducted annual surveys investigating older Americans’ experiences and attitudes regarding long-term care to contribute data to help policymakers, health care systems, and families address this issue.5 Prior years of the poll focused on Americans age 40 and older. For the first time, this year’s study also explored the perspectives of younger adults, those age 18-39, generating new insights into their personal experiences with caregiving and their views of long‑term care. This survey from The AP-NORC Center dives further into the experiences of informal caregivers age 18 and older, exploring the opportunity costs and health impacts on those who devote their time to providing long-term care.
This AP-NORC Center study, with funding from The SCAN Foundation, includes 1,024 interviews with a nationally representative sample of Americans age 18 and older with past or current experience providing long-term care to a family member or friend. Forty-eight percent of the sample are current caregivers. Data were collected using NORC’s AmeriSpeak® Panel.
Additional findings from this study include:
- Twenty-four percent of caregivers see their caregiving role as essential to their identity, 43 percent consider it important, but not essential, 18 percent say it is not too important, and 14 percent say it is not important at all to their personal identity.
- Ninety percent of caregivers have accompanied the person they assist to a medical appointment, and 70 percent of these caregivers say they actually go into the exam room rather than stay in the waiting room.
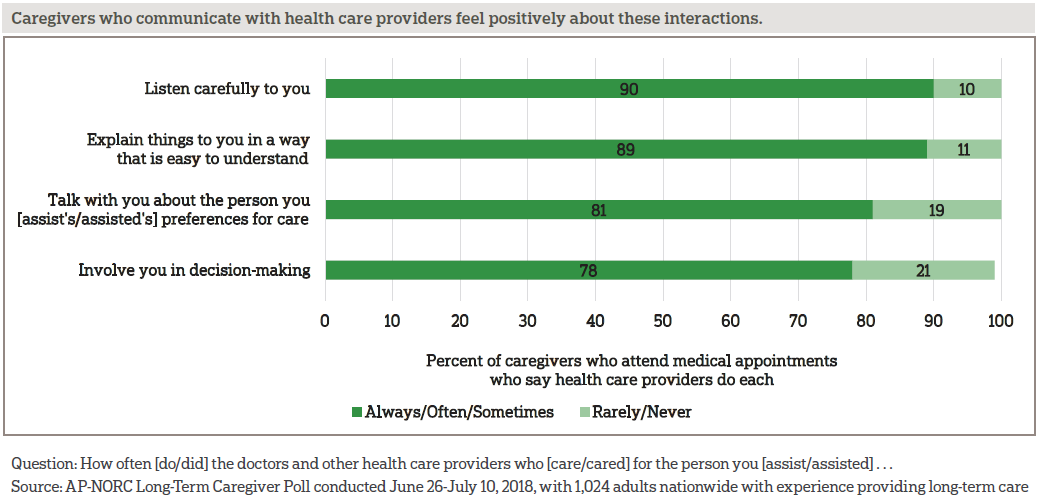
- A majority of caregivers who attend medical appointments give health care providers high marks for explaining things well (72 percent), listening carefully (67 percent), talking with them about the care recipients’ preferences for care (57 percent), and involving them in decision-making (53 percent).
- Only 24 percent of informal caregivers have talked with their own doctors about their responsibilities. But when these conversations do occur, three-quarters say their doctor spoke about how to take care of themselves.
- Forty-five percent of caregivers have a legal document that allows them to make decisions about medical care if the person they assist can no longer make them, and 46 percent have a HIPAA authorization allowing the person’s health care providers to speak with them.
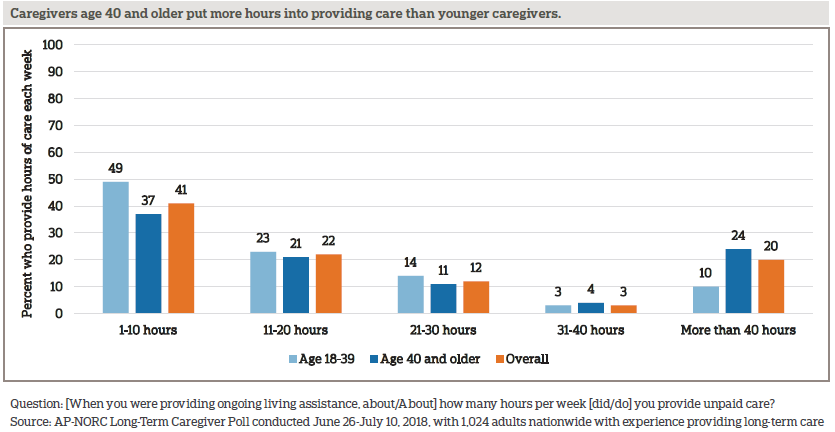
- Caregivers age 40 and older are more than twice as likely as caregivers age 18-39 to provide care for 40 hours or more each week.
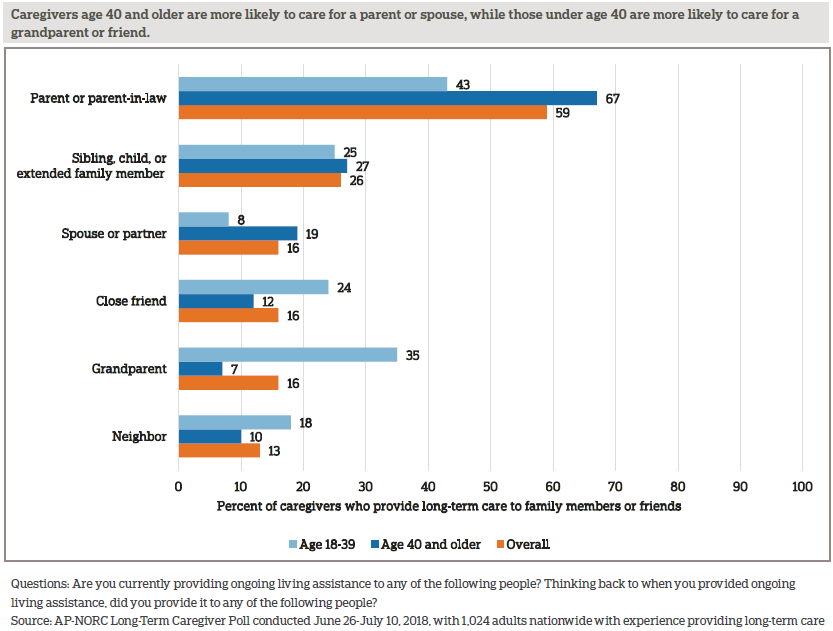
- Caregivers age 40 and older are more likely to care for a parent or spouse, while those under age 40 are more likely to care for a grandparent or friend.
- Caregivers under age 40 are more likely than older caregivers to stop or delay their education (21 percent vs. 9 percent) as a result of providing long-term care.
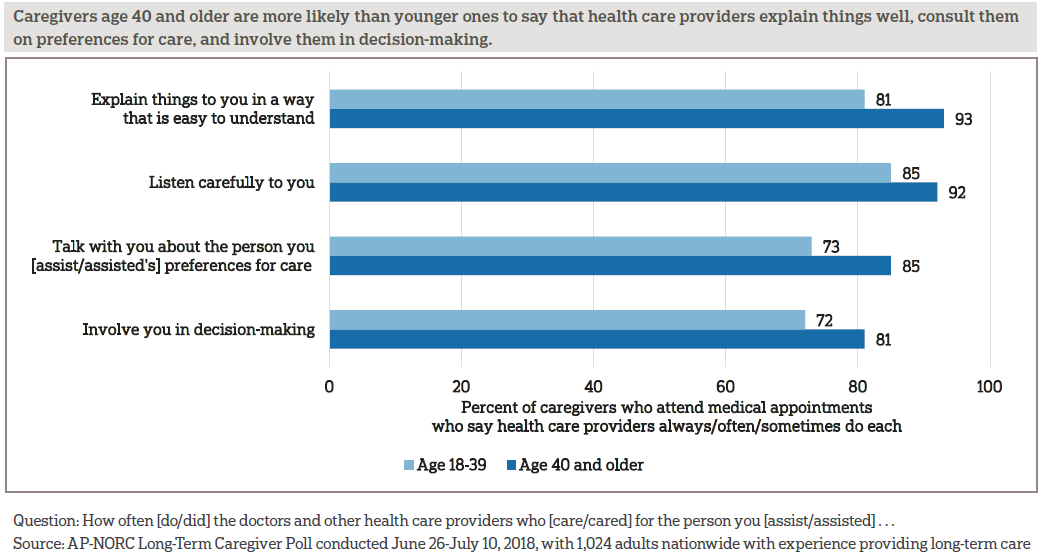
- Caregivers under age 40 are less likely than older caregivers to say health care providers explain things well (81 percent vs. 93 percent), talk with them about preferences for care (73 percent vs. 85 percent), and involve them in decision-making (72 percent vs. 81 percent).
Additional information, including the survey’s complete topline findings, can be found on The AP-NORC Center’s long-term care project website at www.longtermcarepoll.org.
WHO ARE AMERICAN CAREGIVERS?ꜛ
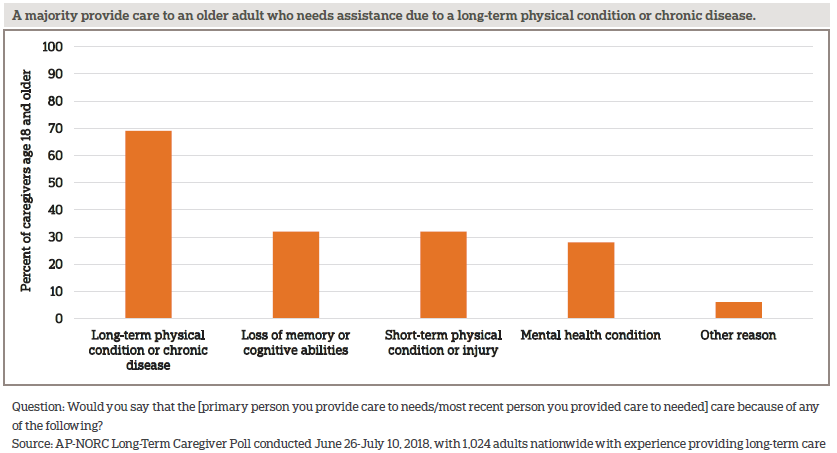
Forty percent of Americans have experience providing long-term care to a family member or friend, and the proportion with caregiving experience is similar among adults age 18-39 and those age 40 and older.6, 7, 8 A majority care for family members or friends with long-term diseases or physical conditions. They often travel to someone else’s home to provide this care and very rarely get paid for their efforts.
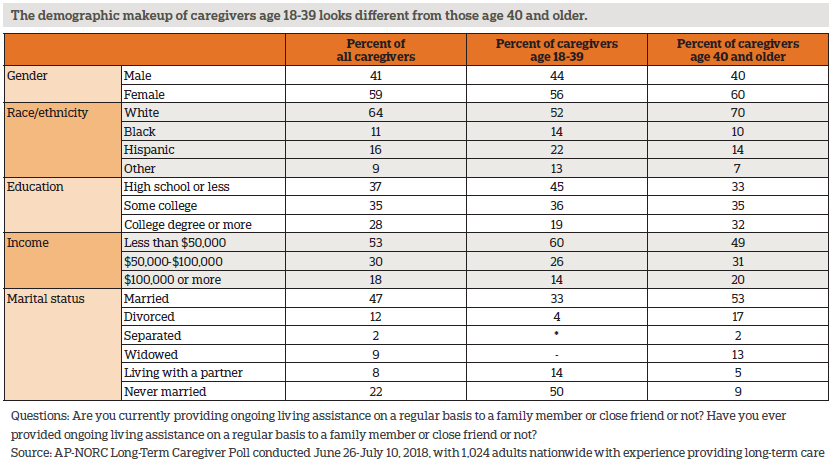
Fifty-nine percent of caregivers are women, and the gender breakdown among caregivers is similar across age groups.
Younger caregivers differ from older caregivers in several ways, roughly reflecting differences in the overall population of adults age 18-39 compared to those age 40 and older. With regard to racial and ethnic make-up, those age 18-39 have more racial and ethnic diversity compared to caregivers age 40 and older. Those under age 40 are more likely than older caregivers to have a lower income, and they are less likely to have a college degree. They are less likely to be married, divorced, or widowed, and are more likely than those age 40 and older to be living with a partner or to have never been married.
Most caregivers care for a parent or parent-in-law; younger caregivers and those age 40 and older tend to provide care to different types of family members and friends.
Two-thirds of caregivers have provided care in the past 12 months, and among these, 68 percent of them provided care for one person during that time, 22 percent provided care for two people, and 9 percent provided care for three or more people.
These caregivers help older loved ones with functional limitations due to different types of mental and physical conditions. The loss of mental abilities or memory, short-term physical conditions, long-term physical conditions, mental health conditions, and other conditions can all result in the need for long-term care. Forty-eight percent of caregivers say the person they care for needs help because of limitations from more than one type of condition.
Over half of caregivers travel to someone else’s home to administer care. Forty-one percent travel to the home of the person they provide care to, and 11 percent travel to another person’s home, while 37 percent administer care in their own home. Seven percent provide care to a family member or friend in a nursing home, and 3 percent in a senior community. Younger and older caregivers mostly provide care in the same locations, with the exception of traveling to someone other than the care recipient’s home to provide care, which 18 percent of caregivers age 18-39 do compared to 8 percent of those age 40 and older.
Americans who provide long-term care to family members and friends are rarely paid for their work. Fourteen percent overall have been paid for providing care. Those age 40 and older are even less likely to receive pay. Twenty-four percent of those age 18-39 have been paid, compared to just 9 percent of those age 40 and older.
In addition to providing long-term care for family members and close friends, one-third have also provided regular ongoing living assistance to other people in the community who they did not know well prior to providing that care. Caregivers age 18-39 are twice as likely as those age 40 and older to provide care to someone in their community other than a family member or friend (56 percent vs. 25 percent).
CAREGIVERS DEVOTE MANY HOURS TO PROVIDING ASSISTANCE, AND FOR SOME IT’S THE EQUIVALENT OF A FULL-TIME JOB.ꜛ
For a majority of caregivers, being a caregiver is an important part of their personal identity, and for nearly one-quarter, the amount of time they put into caregiving is the equivalent of a full-time job. Caregivers age 40 and older are more than twice as likely as caregivers under age 40 to provide care for 40 hours or more each week.
Older caregivers also tend to have provided care for longer durations of time compared to younger caregivers. Among those age 40 and older, 56 percent have provided care for more than two years, compared to 33 percent of those age 18-39. And 36 percent of caregivers under age 40 have provided care for less than one year, compared to 19 percent of those 40 and older.
Most caregivers view that experience as an important part of their identity. Overall, 24 percent see their role as a caregiver as essential to their identity, 43 percent see it as important but not essential, 18 percent view caregiving as not too important, and 14 percent say it is not important at all to their personal identity.
Both their tenure as a caregiver and the number of hours spent providing care each week are related to their sense of identity. Those who have provided care for two years or more are more likely than those who have provided care for less than one year to view caregiving as important or essential to their identity (71 percent vs. 59 percent). Similarly, those who provide care for more than 20 hours a week are more likely than those who spend less time caregiving to consider their role as an essential or important aspect of their personal identity (74 percent vs. 63 percent).
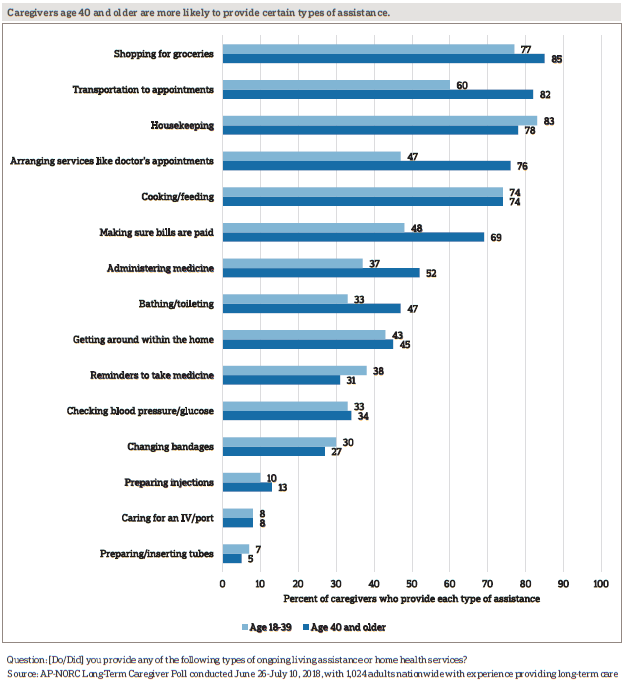
Caregivers take on a wide variety of tasks in the course of providing assistance to their older family members and friends, most commonly grocery shopping (83 percent), housekeeping (79 percent), and providing transportation to appointments (75 percent). In addition to helping out around the house, more than two-thirds of caregivers assist with medicine or health monitoring, and nearly half provide actual medical care.
Younger caregivers are just as likely as those age 40 and older to provide most types of assistance in the course of providing long-term care. However, caregivers age 40 and older are more likely to engage in activities like providing transportation to appointments, arranging services, making sure bills are paid, and administering medicine.
EIGHT IN 10 CAREGIVERS SPEND THEIR OWN MONEY ON CAREGIVING COSTS, AND MANY HAVE HAD TO REDUCE SAVINGS OR CUT BACK ON OTHER EXPENSES TO DO SO.ꜛ
In addition to the hours they put into providing care, 8 in 10 caregivers pay for costs associated with caregiving out of their own pockets. Thirty percent spend $1 to $99 per month, 35 percent spend $100 to $499, 6 percent spend $500 to $999 a month, and another 6 percent spend $1000 or more a month.
Those who provide 10 or more hours of care per week are more likely than are those who spend fewer hours caregiving to pay long-term care costs out of their own pockets (83 percent vs. 70 percent), and they are also more likely to spend $500 or more a month on these costs (16 percent vs. 8 percent). Additionally, those who care for a parent are particularly likely to spend their own money on costs related to providing long-term care (83 percent vs. 69 percent caring for others).
Among those who spend their own money on caregiving costs, many have used personal savings or retirement or education funds. About 2 in 10 assumed debt to cover these expenses.
Some caregivers also cut back on their own day-to-day expenses. Among all caregivers, 49 percent say they’ve gone out to eat less, 42 percent have cut back on other entertainment, 37 percent on household maintenance, 30 percent on clothes or personal items, 25 percent on groceries, 18 percent on spending on personal health care/medicine, 12 percent on basic utilities, and 11 percent on their children’s education.
Some of these financial tolls fall harder on younger caregivers. Compared to older caregivers, those under age 40 are more likely to reduce how much they put into educational savings (29 percent vs. 11 percent), to cut back on spending on their own or their children’s education (17 percent vs. 8 percent), and to cut back on spending on their own health care or medicine (24 percent vs. 15 percent).
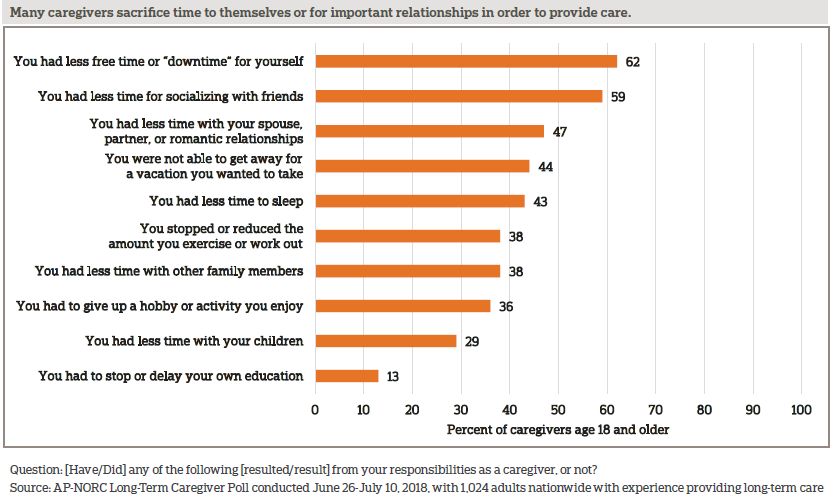
FINANCES ARE NOT THE ONLY COSTS CAREGIVERS FACE; THE OPPORTUNITY COSTS OF PROVIDING CARE TOUCH MANY ASPECTS OF CAREGIVERS’ LIVES.ꜛ
With nearly 6 in 10 caregivers spending more than 10 hours a week providing care, it becomes difficult to make time for other things in their personal lives. While less free time for themselves is the most commonly cited effect, most also have less time for friends, children, spouses or partners, or other family. About 4 in 10 say they gave up time for sleep, exercise, or hobbies. Roughly 1 in 10 say they had to stop or delay their education.
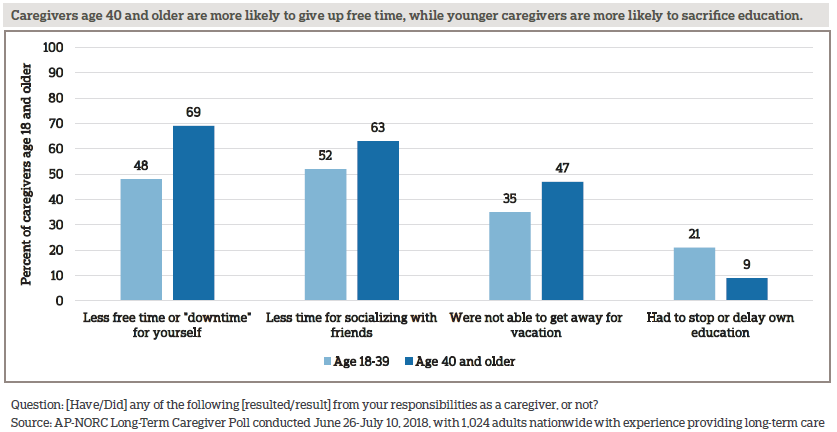
Those age 40 and older are more likely than younger caregivers to say they have less time for themselves, friends, or vacation, while younger caregivers are more likely to have stopped or delayed their education.
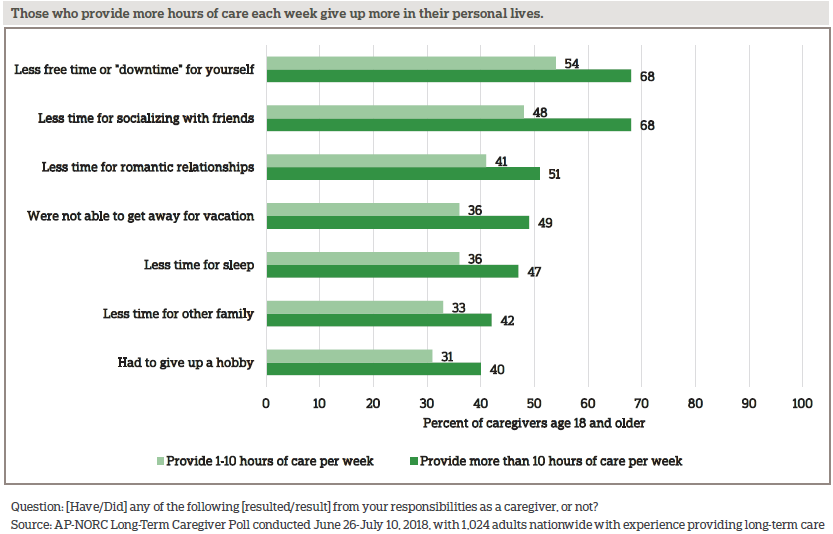
Those who provide more than 10 hours of care a week bear a higher burden compared to those who spend less time providing weekly care. Caregivers who spend more time providing care each week have less time for a variety of other activities, especially free time, friends, romantic relationships, vacations, sleep, other family, and hobbies.
Other differences emerge by race, gender, and income. Whites are more likely than non-whites to say that caregiving left them with less free time for themselves (67 percent vs. 53 percent). Women are more likely than men to say they had less time with their children (33 percent vs. 24 percent). And those who earn more than $50,000 a year are more likely than those who earn less to say they had less time for their spouse or partner (53 percent vs. 40 percent).
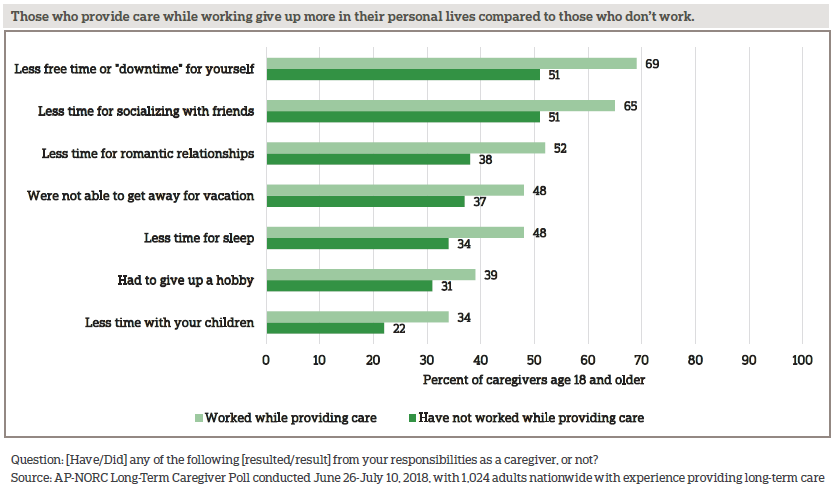
Sharp differences emerge between the 61 percent of caregivers who work while providing care and those who do not. Those who work and provide care are more likely to give up many aspects of their personal lives.
Providing care also impacts caregivers’ lives at work. To accommodate their role, nearly half of those who have provided care while working have used vacation time to provide care. Others have changed their work schedule, took leave without pay, or even switched from full-time to part-time work. Few used the Family Medical Leave Act (FMLA) to take time off work, possibly due to the restrictions around FMLA eligibility or a lack of awareness of the program.9
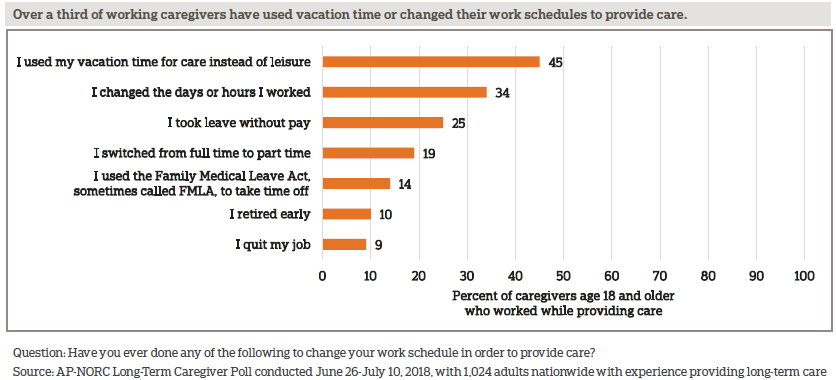
Some working caregivers have experienced serious repercussions at work because of their need to provide care, including having their roles or responsibilities changed (13 percent), being treated differently (12 percent), or being excluded from job growth opportunities (12 percent). While just 3 percent say they were fired or were asked to resign as a result of their role as a caregiver, 10 percent of working caregivers decided to retire early and 9 percent quit in order to provide long-term care.
AMONG THOSE CURRENTLY PROVIDING CARE, ONE-THIRD HAVE GONE WITHOUT NEEDED CARE THEMSELVES AND A QUARTER HAVE FOUND IT HARDER TO MANAGE THEIR OWN HEALTH.ꜛ
Although most current caregivers are in good health and don’t see their caregiving role as interfering with their health, a substantial group experiences opportunity costs due to caregiving that impact their health, often dealing with chronic conditions and obstacles to managing and seeking care for themselves.
Nearly a quarter describe their health as fair or poor, and a similar proportion report their mental or emotional health as fair or poor. Fully 39 percent of caregivers have a health condition, physical limitation, or mental health condition that impacts their daily life or limits their activities.
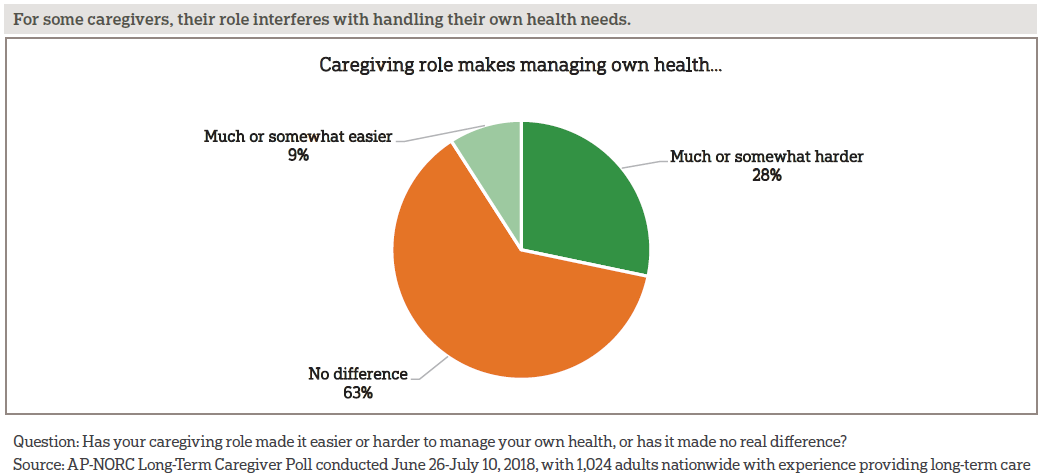
When it comes to managing their own health, more than a quarter of current caregivers say that their caregiving responsibilities make it difficult to do so. What is more, among caregivers with chronic conditions, 40 percent say that their caregiving role makes it harder to manage their own health compared to 22 percent of caregivers without chronic conditions who say the same.
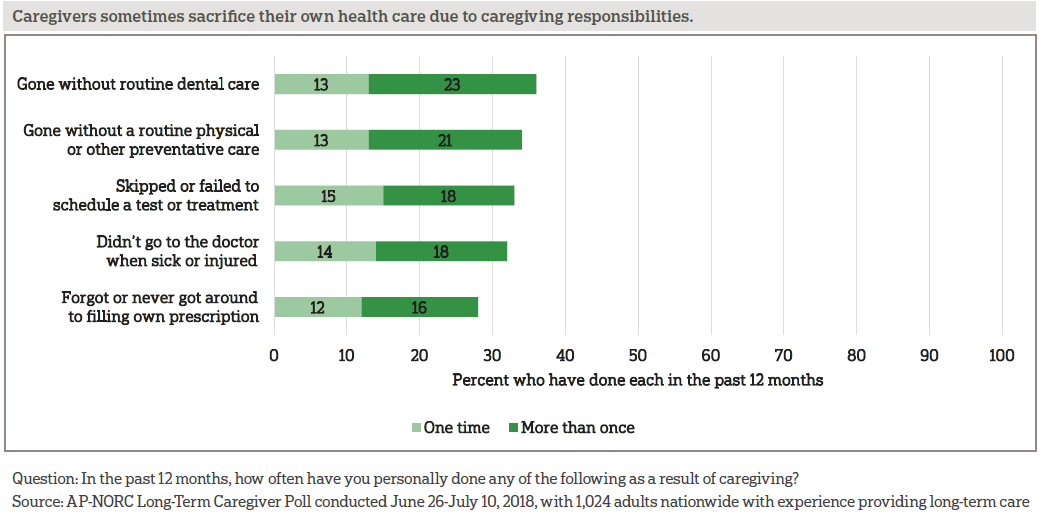
The balancing act of caregiving and health can result in caregivers cutting back on their own care. About a third of caregivers each have gone without dental care or a routine physical, skipped or failed to schedule a test or treatment, haven’t gone to the doctor when sick or injured, or forgot to fill their own prescription.
Established links between social support and health, which are believed to be both physiological and behavioral, are reflected in caregivers’ reports of their own levels of support and health.10 Caregivers who say they have all or most of the social and emotional support they need are far less likely to be in fair or poor physical (16 percent vs. 41 percent) or mental (13 percent vs. 45 percent) health than those who say they have hardly any or no support. Those with more support experience fewer difficulties with managing their own health (21 percent vs. 43 percent) and are less likely to have gone without health care in the past 12 months as a result of to their caregiving responsibilities (42 percent vs. 77 percent).
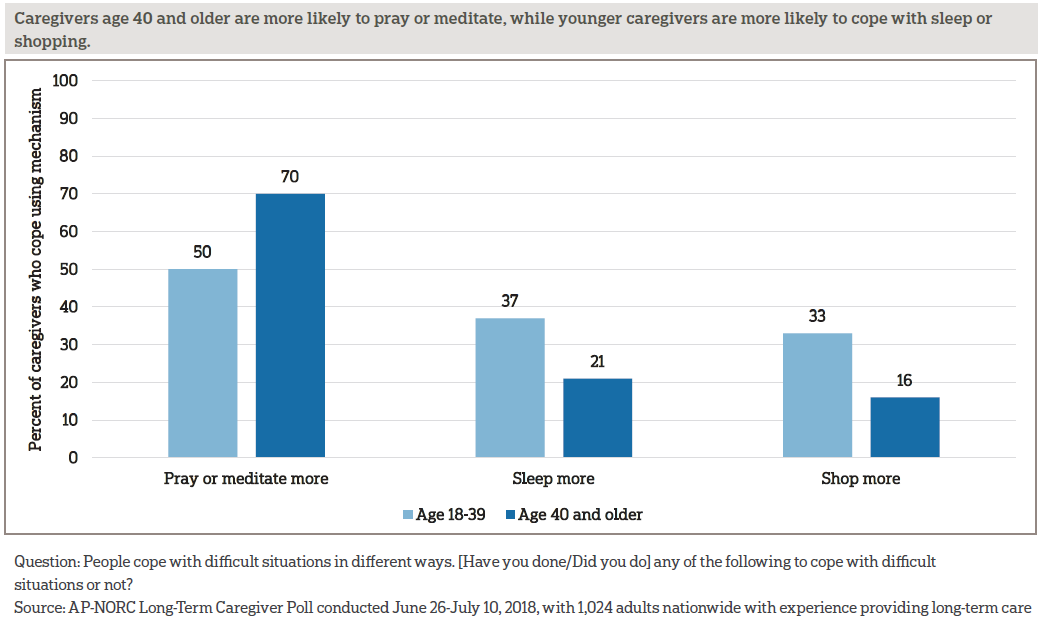
CAREGIVERS EMPLOY A VARIETY OF WAYS TO COPE WITH DIFFICULT SITUATIONS, AND THESE INCLUDE HEALTHY AND UNHEALTHY BEHAVIORS.ꜛ
While praying or meditating is the most commonly cited coping mechanism, caregivers turn to a wide range of methods to cope with difficult caregiving situations. Changing sleep patterns is a common coping mechanism, with nearly half of caregivers saying they sleep less and a quarter saying they sleep more. Many caregivers turn to unhealthy behaviors, with about 4 in 10 caregivers avoiding talking to people about the situation, about 3 in 10 caregivers eating more, and about 2 in 10 smoking or drinking more.
Some of the ways that caregivers cope with the stresses of providing care differ by age. Those age 40 and older are more likely than younger caregivers to cope by praying or meditating, while those age 18-39 are more likely than older caregivers to sleep more or shop more.
Current caregivers are also not getting the recommended amount of sleep each night. Eight percent of current caregivers are getting by with four hours or less of sleep per night, 44 percent get four to six hours, 39 percent get six to eight hours, and just 6 percent get more than eight hours. Current caregivers who provide more than 10 hours of care each week are more likely to get six hours or less of sleep a night than are those who provide 10 hours or less of weekly care (62 percent vs. 41 percent).
Nor are current caregivers getting recommended amounts of exercise, although they are no less likely to exercise than the broader population of American adults. While 13 percent of current caregivers exercise every day and 43 percent a few times a week, 17 percent of current caregivers exercise just a few times a month and 27 percent report exercising less often than that.
MOST CAREGIVERS ARE INVOLVED AND HAVE POSITIVE INTERACTIONS WITH HEALTH CARE PROVIDERS, BUT FEW RECEIVE INFORMATION ABOUT HOW TO CARE FOR THEMSELVES.ꜛ
Nearly all caregivers have accompanied the person they assist to a medical appointment, and over half say this is something they do often. Thirty-seven percent of caregivers always go to medical appointments, 18 percent often attend, 26 percent sometimes attend, 10 percent rarely attend, and just 10 percent have never attended a medical appointment.
Of those who have attended a medical appointment, 70 percent actually go into the exam room with the person they assist, whereas 29 percent stay in the waiting area.
Most caregivers who attend appointments feel that health care providers do a good job of explaining things and listening to them. In addition, majorities of these caregivers say health care providers speak with them about the person’s preferences for care and involve them in the decision-making.
Caregivers’ perceptions of their interactions with health care providers vary by age, as older caregivers rate the quality of their provider interactions more positively than younger ones.
Further, among caregivers who attend medical appointments, 8 in 10 feel respected or valued in their interactions with the health care providers. Eighteen percent say they have been dismissed by health care providers, and 16 percent feel ignored.
While the majority of caregivers age 18-39 feel respected in their interactions with health care providers, they are less likely than older caregivers to feel this way. Ninety percent of caregivers age 40 and older feel respected compared to 77 percent of caregivers under age 40.
Although nearly all caregivers have accompanied the person they assist to a medical appointment, less than half of caregivers report having formal authorizations in place that allow them to communicate with health care providers about the treatment of the person they assist. Forty-five percent of caregivers have a legal document that allows them to make decisions about the person they assist’s medical care if they can no longer make them on their own, and another 46 percent have a HIPAA authorization allowing the person’s health care providers to speak with them about their health and treatment.
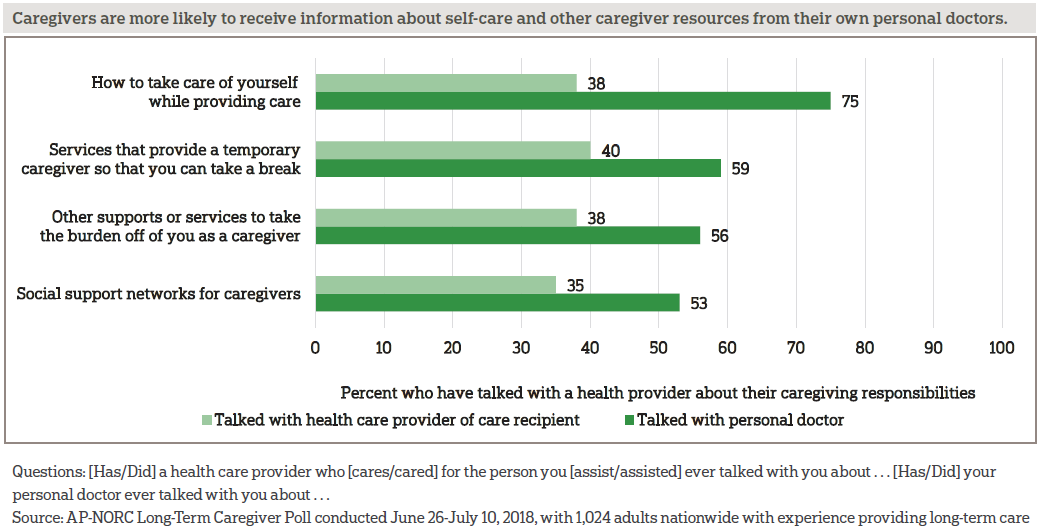
Few caregivers have talked to their own doctors about being a caregiver. Only 24 percent of caregivers have spoken with their own doctors about their caregiving responsibilities, but among those who have, three-quarters say their doctor discussed how they could take care of themselves while providing care. Fewer, but still a majority, report their doctor talked with them about respite services that can provide a temporary caregiver, social support networks, or other supports or services for caregivers.
Caregivers are more likely to have these types of conversations with their own doctor than they are to have them with the health care providers of the people they assist.
MOST SHARE CAREGIVING RESPONSIBILITIES AND FEEL SUPPORTED, YET ABOUT HALF OF CURRENT CAREGIVERS REPORT FEELING LONELY.ꜛ
A majority of caregivers do share the responsibilities of providing long-term care with someone else (62 percent). However, caregivers who provide care to a spouse or partner are much less likely to have someone to share the responsibilities with compared to those caring for others (41 percent vs. 66 percent).
Three-quarters of caregivers report that they have other family members or close friends who can cover their responsibilities temporarily if they need a break. But only 25 percent report having access to a respite care program, and only 21 percent have access to an adult day care or community senior services.
Notably, only about half of caregivers (54 percent) say there is a plan in place for who would provide care in the event they were no longer able to do it themselves. Age is related to transition planning among caregivers, with those age 40 and older being more likely to have such a plan in place than younger caregivers (59 percent vs. 46 percent).
While 60 percent of caregivers say they have most or all of the social and emotional support they need to provide long-term care, 23 percent have just some support, and 17 percent say they have hardly any or none of the support they need.
Caregivers’ perceptions of their social and emotional support are related to their access to resources, such as respite care programs and adult day care or community senior services. Nineteen percent of caregivers without access to a respite program report having little or no social and emotional support, while only 11 percent of those with access to a respite program report the same. Similarly, caregivers without access to an adult day care or community senior services are more likely to say they have hardly any or no social and emotional support compared to those with access (19 percent vs. 10 percent).
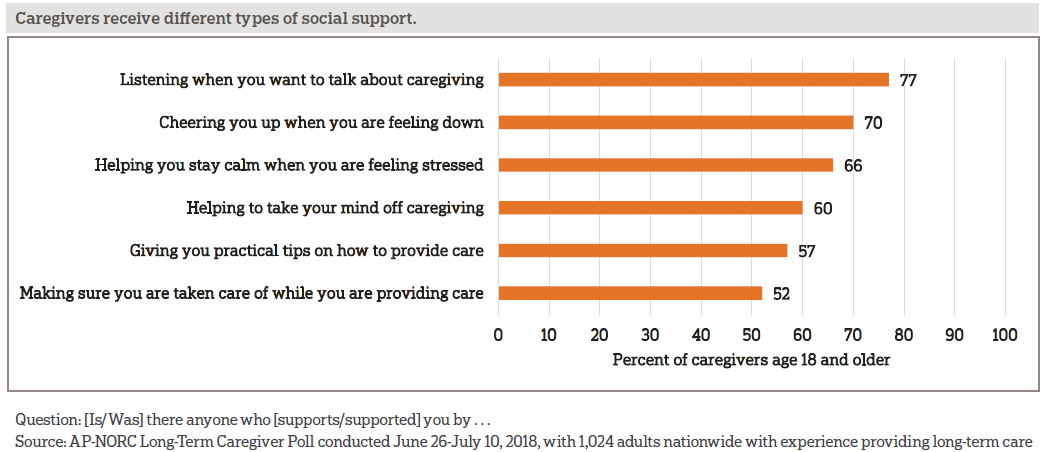
Seventy-seven percent of caregivers have someone who listens when they want to talk about caregiving or someone who cheers them up when they’re feeling down. Sixty-six percent have someone who helps them stay calm when feeling stressed or helps them take their mind off caregiving. While still a majority, fewer say they have someone to provide practical tips on how to provide care or make sure they themselves are taken care of.
Over half of current caregivers feel lonely at least some of the time. Age is a strong factor in these feelings. Current caregivers age 18-39 are much more likely to report feeling lonely at least some of the time compared to caregivers above the age of 40 (74 percent vs. 46 percent).
Household income is another factor that contributes to these feelings among those currently providing care. Over half of those making less than $50,000 annually report feeling lonely (53 percent) compared to a minority among those making between $50,000 and $100,000 (41 percent) and those making more than a $100,000 (37 percent). And those providing long-term care to someone because of a mental condition like anxiety or depression are more likely to report feeling lonely in the past week than are those who provide care for other reasons (59 percent vs. 42 percent).
About the Studyꜛ
Study Methodology
This study, funded by The SCAN Foundation, was conducted by The Associated Press-NORC Center for Public Affairs Research. Data were collected using AmeriSpeak®, NORC’s probability-based panel designed to be representative of the U.S. household population. During the initial recruitment phase of the panel, randomly selected U.S. households were sampled with a known, non-zero probability of selection from the NORC National Sample Frame and then contacted by U.S. mail, email, telephone, and field interviewers (face-to-face). The panel provides sample coverage of approximately 97 percent of the U.S. household population. Those excluded from the sample include people with P.O. Box only addresses, some addresses not listed in the USPS Delivery Sequence File, and some newly constructed dwellings. Staff from NORC at the University of Chicago, The Associated Press, and The SCAN Foundation collaborated on all aspects of the study.
Interviews for this survey were conducted between June 26 and July 10, 2018, with adults age 18 and older with experience providing long-term care to a family member or friend representing the 50 states and the District of Columbia. Panel members were randomly drawn from AmeriSpeak and invited to complete a screener to determine their eligibility for the survey. In addition, panelists who completed the 2018 Long-Term Care Trend Poll and answered that they had experience providing long-term care were invited to complete the screener. Those with current or past experience providing long-term care in the screener were invited to the survey, and 1,024 completed the survey—871 via the web and 153 via telephone. Interviews were conducted in both English and Spanish, depending on respondent preference. Respondents were offered a small monetary incentive ($4) for completing the survey.
The screener completion rate is 28.6 percent, with an incidence rate of 47.9 percent among newly screened panelists. The final stage completion rate is 97.6 percent, the weighted household panel response rate is 33.7 percent, and the weighted household panel retention rate is 87.2 percent, for a cumulative AAPOR response rate 3 of 8.2 percent. The overall margin of sampling error is +/- 4.1 percentage points at the 95 percent confidence level, including the design effect.
Once the sample has been selected and fielded, and all the study data have been collected and made final, base sampling weights for the selected sample are adjusted for screener nonresponse, and then a poststratification process is used to adjust for any survey nonresponse. Poststratification variables included age, gender, census division, race/ethnicity, and education. Population totals for U.S. adults age 18 and older who have experience providing long-term care were obtained using the screener nonresponse adjusted weight for all eligible respondents from the screener questions. At the final stage of weighting, any extreme weights were trimmed based on a criterion of minimizing the mean squared error associated with key survey estimates, and then, weights were re-raked to the same population totals. The weighted data reflect the U.S. population of adults age 18 and over who have experience providing long-term care.
All analyses were conducted using STATA (version 15), which allows for adjustment of standard errors for complex sample designs. All differences reported between subgroups are at the 95 percent level of statistical significance, meaning that there is only a 5 percent (or less) probability that the observed differences could be attributed to chance variation in sampling. Additionally, bivariate differences between subgroups are only reported when they also remain robust in a multivariate model controlling for other demographic and socioeconomic covariates.
A comprehensive listing of all study questions, complete with tabulations of top-level results for each question, is available on The AP-NORC Center for Public Affairs Research long-term care website: www.longtermcarepoll.org.
Contributing Researchers
From NORC at the University of Chicago
Jennifer Titus
Dan Malato
Jennifer Benz
Liz Kantor
William Bonnell
Tomas Okal
Caroline Smith
Trevor Tompson
From The Associated Press
Emily Swanson
Hannah Fingerhut
About The Associated Press-NORC Center for Public Affairs Research
The AP-NORC Center for Public Affairs Research taps into the power of social science research and the highest-quality journalism to bring key information to people across the nation and throughout the world.
- The Associated Press (AP) is the world’s essential news organization, bringing fast, unbiased news to all media platforms and formats.
- NORC at the University of Chicago is one of the oldest and most respected, independent research institutions in the world.
The two organizations have established The AP-NORC Center for Public Affairs Research to conduct, analyze, and distribute social science research in the public interest on newsworthy topics, and to use the power of journalism to tell the stories that research reveals.
The founding principles of The AP-NORC Center include a mandate to carefully preserve and protect the scientific integrity and objectivity of NORC and the journalistic independence of AP. All work conducted by the Center conforms to the highest levels of scientific integrity to prevent any real or perceived bias in the research. All of the work of the Center is subject to review by its advisory committee to help ensure it meets these standards. The Center will publicize the results of all studies and make all datasets and study documentation available to scholars and the public.
Footnotes
1. Vespa, J., Armstrong, D.M., and Medina, L. (2018). Demographic turning points for the United States: Population projections for 2020 to 2060. Current Population Reports, P25-1144. Washington, DC: U.S. Census Bureau. https://www.census.gov/content/dam/Census/library/publications/2018/demo/P25_1144.pdfꜛ
2. The Associated Press-NORC Center for Public Affairs Research. (2018). Younger Adults’ Experiences and Views on Long-Term Care. https://www.longtermcarepoll.org/project/younger-adults-experiences-and-views-on-long-term-care/ ꜛ
3. U.S. Department of Health and Human Services. (2017). How Much Care Will You Need? https://acl.gov/ltc/basic-needs/how-much-care-will-you-need
4. The Associated Press-NORC Center for Public Affairs Research. (2018). Long-Term Care in America: Increasing Access to Care. https://www.longtermcarepoll.org/project/long-term-care-in-america-increasing-access-to-care/ꜛ
5. In 2013-2016, interviews were conducted through a random digit dial telephone survey on landlines and cell phones with samples of adults age 40 and older. In 2017-2018, interviews were conducted via either web or phone using the AmeriSpeak Panel, the probability-based panel of NORC at the University of Chicago. Reports and topline findings for all years can be found at: https://longtermcarepoll.org/Pages/Default.aspxꜛ
6. The Associated Press-NORC Center for Public Affairs Research. (2018). Long-Term Care in America: Increasing Access to Care. https://www.longtermcarepoll.org/project/long-term-care-in-america-increasing-access-to-care/ꜛ
7. Respondents were provided with the following definition of ongoing living assistance: “Some people need ongoing living assistance as they get older. This assistance can be a help with things like keeping house, cooking, bathing, getting dressed, getting around, paying bills, remembering to take medicine, or just having someone check in to see that everything is okay. This help can happen at your own home, in a family member’s home, in a nursing home, or in a senior community. And, it can be provided by a family member, a friend, a volunteer, or a health care professional.”ꜛ
8. Ongoing living assistance could be current or in the past, and question wording was adjusted accordingly. The questionnaire logic specified that present tense was displayed for current providers, while past tense was displayed for former providers. For the purposes of this report, we refer to caregiving in the present tense.ꜛ
9. To be eligible for FMLA, an individual must be employed by a company that employs 50 or more individuals within a 75-mile radius of the worksite and must have been employed with the company for 12 months and worked at least 1,250 hours during the 12 months prior to the start of their leave. U.S. Department of Labor. (2012). Fact Sheet #28: The Family and Medical Leave Act. https://www.dol.gov/whd/regs/compliance/whdfs28.pdfꜛ
10. Reblin, M., and Uchino, B.N. (2008). Social and emotional support and its implication for health. Current Opinion in Psychiatry, 21(2), 201. https://www.ncbi.nlm.nih.gov/pmc/articles/PMC2729718/ꜛ