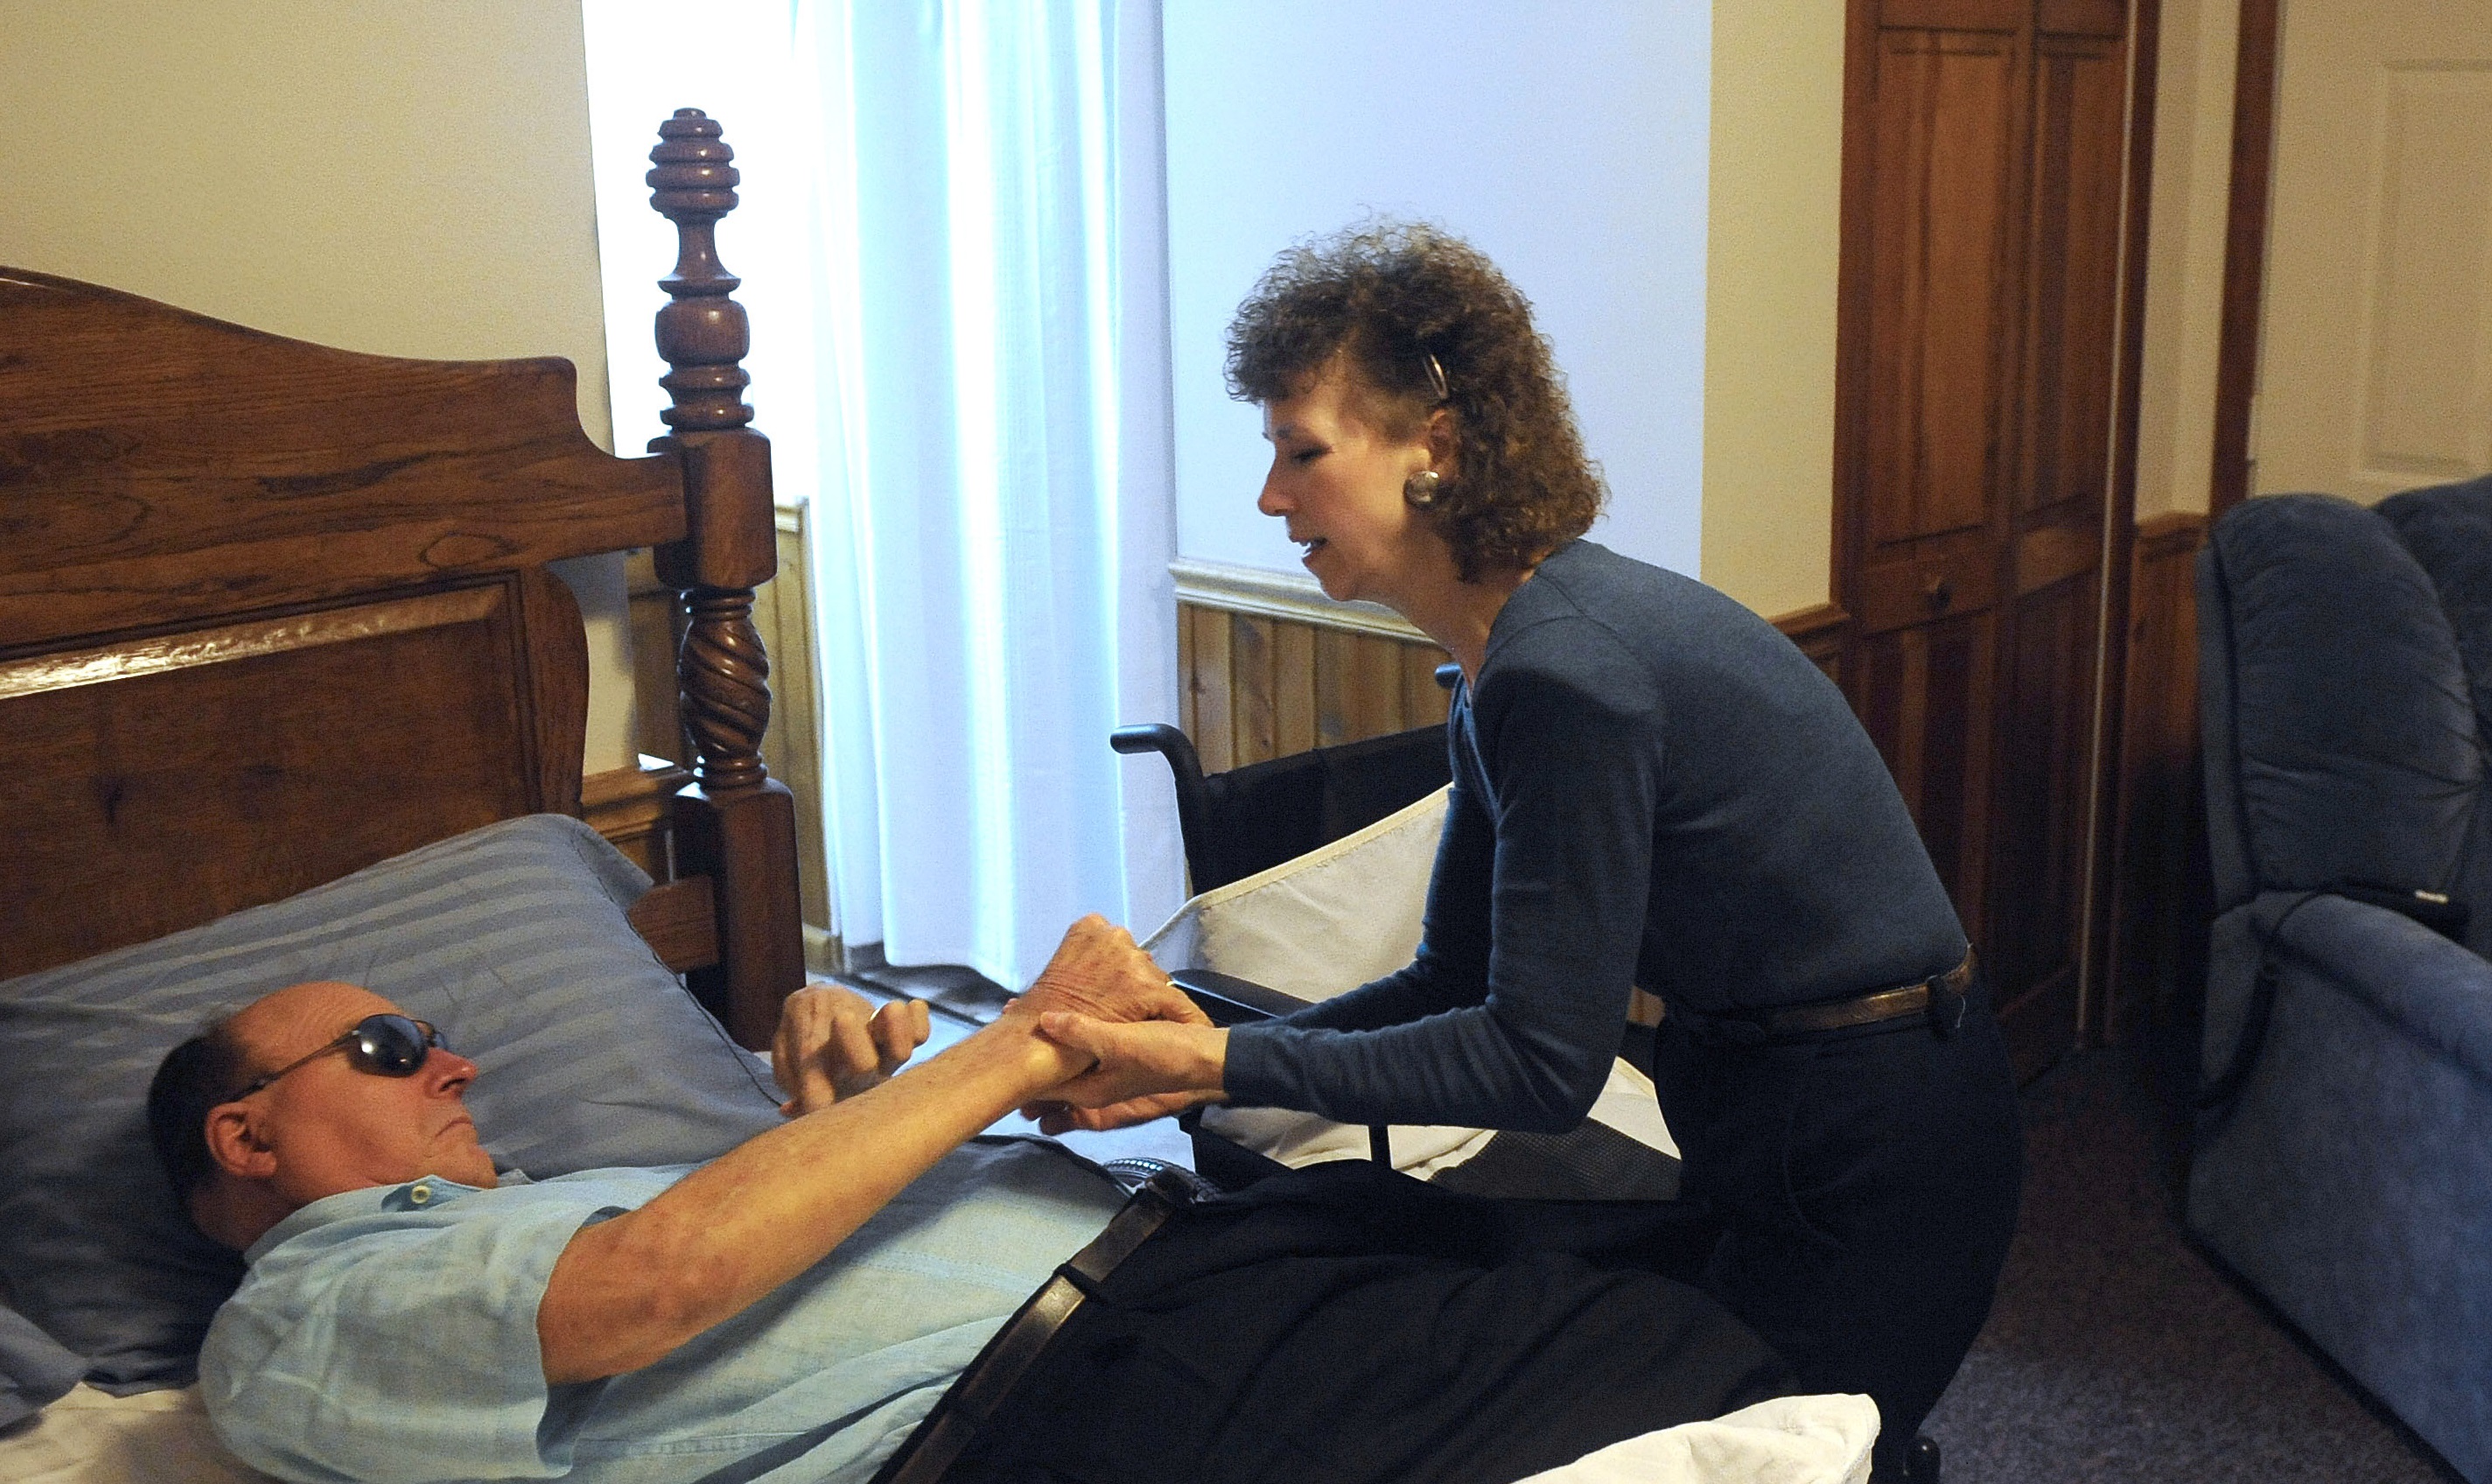
Pauline King, 59, cares for her husband Jerry King, 63, at their home in Anna, Ill., Friday, August 30, 2013. Jerry was diagnosed with Multiple Sclerosis in 1978. He can no longer go to the bathroom, bathe or dress himself without assistance from Pauline. (AP Photo/Stephen Lance Dennee)
In 2013, the Associated Press-NORC Center for Public Affairs Research undertook a major study of public attitudes related to long-term care in the United States. The report found that few Americans age 40 or older are prepared for long-term care—care that they expect to need in the future—and even fewer understand the financial costs involved. The survey revealed that Americans 40 or older are counting on their families to provide assistance for them as they age, and that a majority support a variety of policy options for financing long-term care.
The aim of this second study is to understand better who is providing and receiving care, how caregiving impacts family relationships and personal experience, how Americans 40 or older receive information on long-term care, and which policy measures they think would improve long-term care.
The survey tracked many questions from the 2013 study, and found that most indicators remained relatively stable, including Americans’ understanding of the long-term care system, personal experiences with long-term care, opinions about their own and loved ones’ future care needs, and the extent to which they are planning for their own or their family members’ long-term care. This survey does reveal changes in support for a couple of key long-term care financing policies.
Underscoring the rising importance of long-term care issues on a national level was the formation, in 2013, of a bipartisan long-term care commission by Congress, tasked with proposing a plan for a coordinated, high-quality long-term care system that will address the needs of America’s aging population. Such a plan will address the demographic projection that, with the population of those over age 65 expected to nearly double by the time the last baby boomers have reached this age, seniors will comprise an increasingly significant proportion of the American population.
Specifically, while seniors made up only 12 percent of the U.S. population in 2000, they are expected to comprise about 20 percent by 2030, with roughly 73 million Americans over the age of 65. U.S. Department of Health and Human Services projections estimate that 70 percent of Americans who reach the age of 65 will need some form of long-term care in their lives for an average of three years. How to plan for and finance high-quality long-term care will remain a key policy question for lawmakers in the years to come.
In order to produce new and actionable data about the aging population to inform the national dialogue surrounding long-term care issues, the AP-NORC Center, with funding from The SCAN Foundation, conducted 1,419 interviews with a nationally representative sample of adults age 40 and over.
Key findings from the study are presented below.
- Many Americans 40 or older rely on their families for long-term care, and caregivers provide ongoing living assistance to a variety of family members; 4 in 10 caregivers have provided care to their mothers.
- Caregivers’ experiences with providing care are mostly positive, though perceptions are shaped by demographics and specific family relationships between the caregiver and the recipient.
- Americans 40 or older who have personal experiences with long-term care are more likely to be concerned about planning for long-term care and less likely to think they can rely on family as they age.
- One-third of Americans 40 or older are deeply concerned that they won’t plan enough for the care they might need when they get older, yet two-thirds report having done little or no planning for such assistance.
- Among Americans 40 or older who expect to be a caregiver for family or friends in the next five years, just 3 in 10 say they feel prepared to take on the job.
- Compared to one year ago, Americans are currently more supportive of a government-administered long-term care insurance program, similar to Medicare, and think a number of measures would be helpful for improving the quality of ongoing living assistance.
- Americans lack information about ongoing living assistance. When they do get such information, they tend to hear about it from friends, family, or co-workers, although they have more trust in long-term care information they receive from experts.
- Six in 10 Americans 40 or older have some experience with long-term care, either as caregivers, recipients of care, or financial providers of care. Those who have experienced long-term care tend to be female, lower-income, and in the baby boomer generation. These findings remain stable from the 2013 survey.
Additional information, including the survey’s complete topline findings, can be found on the AP-NORC Center’s long-term care project website at www.longtermcarepoll.org.
A majority of Americans 40 and older have personal experience with the long-term care system—providing, financing, or receiving care.ꜛ
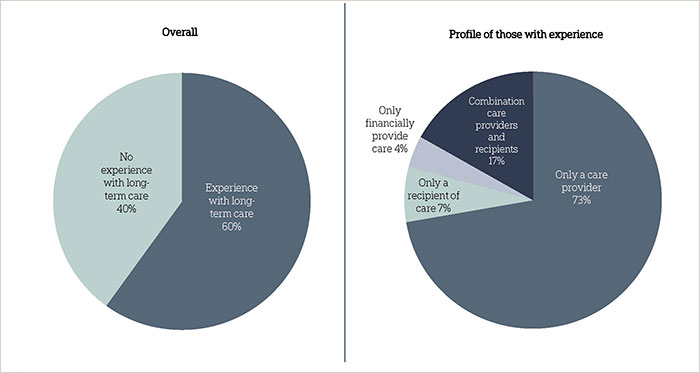
The survey reveals that many Americans 40 or older have experience with long-term care. Six in 10 have either provided, financed, or received ongoing living assistance.1 Similar to the 2013 study, 53 percent say they have provided care on a regular basis to a family member or close friend themselves, either currently or in the past. A majority of those 40 or older who have provided care to a loved one are female (57 percent), have household incomes of less than $50,000 per year (58 percent), or are not employed (54 percent). The majority of caregivers (53 percent) are part of the baby boomer generation, commonly defined as those born in the post-World War II years of 1946 and 1964, with an average age of about 59 years old. Americans’ experience with ongoing living assistance extends to financial support as well. Seven percent of adults 40 or older say that they or someone in their family is currently employing someone to provide in-home ongoing living assistance.
Just over 1 in 10 Americans 40 or older are either current recipients of ongoing living assistance (7 percent), or have received such assistance at some point (4 percent). Six in 10 recipients of care are women, 72 percent have household incomes of less than $50,000, and 42 percent are in the boomer generation.
Among the 6 in 10 Americans who have experience with long-term care, most (73 percent) have only provided care directly to a friend or family member; fewer have only been recipients of care (7 percent) or are solely paying for long-term care (4 percent). Seventeen percent have both provided and received care at some point.
Experiences of Americans 40+ with long-term care
The vast majority of care recipients have been cared for in their own home rather than institutional settings, and by friends or family members rather than professional home health aides. Eighty-six percent of care recipients report they have received care in their own home or a friend’s home, or were cared for by a family member or friend. Fewer than half (42 percent) report ever receiving care from a non-familial source, either in a nursing home, senior community, or by a professional home healthcare aide.
Americans are positive about their experiences providing care to family and friends.ꜛ
The relationships between caregivers and recipients of care extend across generations and throughout the family. In an open-ended question, caregivers were asked how they are related to the person or people to whom they provided care. While a majority of caregivers (56 percent) say they have provided care to a parent—their mother (41 percent), father (17 percent), mother-in-law (8 percent), or father-in-law (3 percent)—many others report providing care for other immediate and extended family members. Specifically, 14 percent have provided care to a spouse or partner, 10 percent to an extended family member, 9 percent to a child, 6 percent to siblings, and 6 percent to grandparents. Another 6 percent say they have provided care to a close friend.
To whom caregivers are providing long-term care services
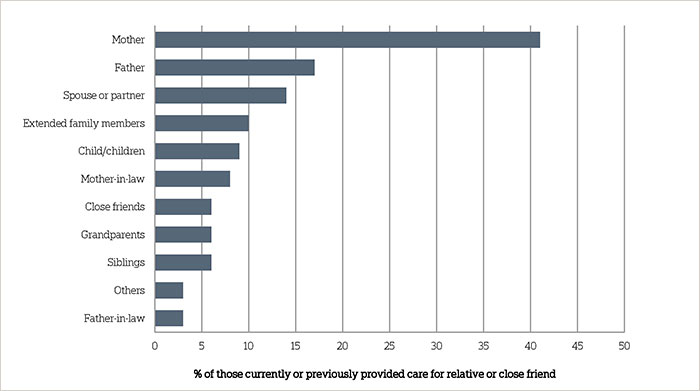
Question: How was the person or people you provided ongoing living assistance to related to you?
Overall, caregivers reflect positively on their experience providing ongoing living assistance to their friends and family, though it does take a toll on many relationships, particularly between spouses. An overwhelming majority (83 percent) say that providing care has been a positive experience in their life; just 15 percent say it has not been a positive experience. Nearly 8 in 10 (77 percent) say that it has strengthened their personal relationships with the person they cared for; conversely, fewer than 1 in 10 (9 percent) say that it weakened their relationship with the recipient of care. Large majorities of caregivers across demographic groups express positive opinions about their experience providing care.
At the same time, half of caregivers (51 percent) report that the experience did cause stress in their family. Caregivers who are women (56 percent) are more likely than men (45 percent) to say the experience caused stress. Those in households with incomes of $50,000 or more (58 percent) are much more likely than those in households with incomes of less than $50,000 (46 percent) to say the experience was stressful for the family. Controlling for other demographic factors, marital status and having children in the home are not associated with reports that the caregiving relationship caused stress.
Less than half of caregivers indicate that their experience providing care has taken time away from family life (42 percent), taken time away from work (38 percent), or has been a burden on their personal finances (29 percent). Still, the responses to these questions do differ among some demographic groups. Those who are married (49 percent) are more likely than those who are not (31 percent) to say caregiving has taken time away from family life. Controlling for other demographic factors, having children in the home is not associated with reports that the caregiving relationship took time away from family.
Caregivers in households earning $50,000 per year or more are more likely than those earning less to say providing care has taken time away from work (47 percent to 30 percent, respectively) or family life (49 percent to 36 percent).
In addition to demographic factors, views about the caregiving experience are also shaped by the relationship between the caregiver and receiver. For example, although at least 7 in 10 caregivers say their experience was positive regardless of who they cared for, those who have cared for a spouse or partner are the least likely say it was a positive life experience. Those who provided care for a spouse are also the most likely to say the experience caused stress in the family, was a burden on their personal finances, and weakened their personal relationship with the person for whom they cared.
Although caregivers are more than twice as likely to report caring for their mother than their father, those who have provided care to their fathers are the most likely to say providing care strengthened their personal relationship with the person for whom they cared.
Caregivers and their experience providing care by relationship to receiver of care
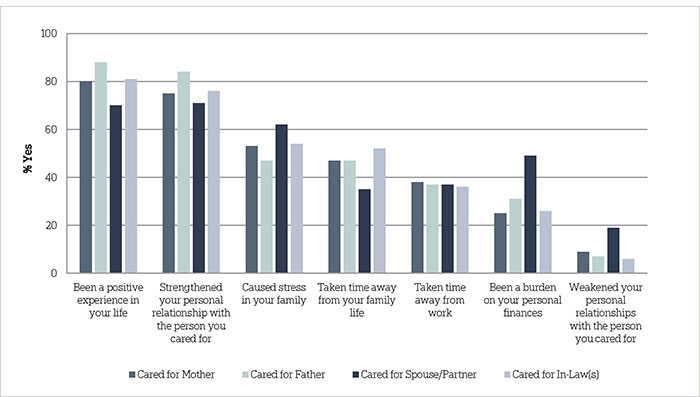
Question: When you think about your personal experience providing ongoing living assistance would you say that it has…or not?
Americans continue to feel confident that they can rely on their families as support systems to provide help as they age.ꜛ
Most people expect their families to be there for support as they grow older. Seven in 10 Americans 40 or older think they can rely on their family a great deal or quite a bit in their time of need. Yet those with any experience with ongoing living assistance – either receiving or providing care – are less likely to say they can rely on their families than those with no such experience (67 percent vs. 74 percent).
A majority of Americans 40 or older believe they can rely on their family in a time of need
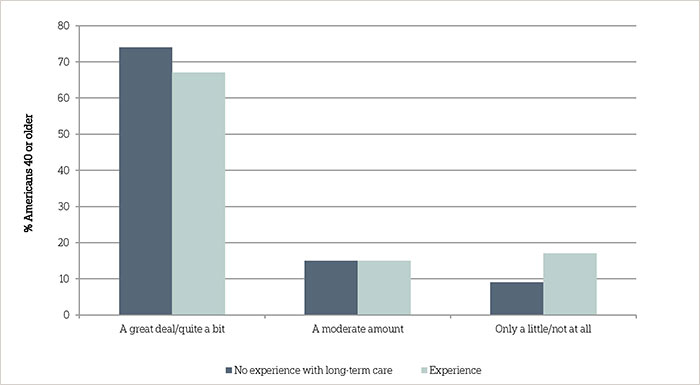
Question: How much do you feel you can rely on your family to be there for you in a time of need?
Americans 40 or older with lower incomes differ in where they expect to receive help and support as they grow older compared to those with higher incomes. Those who earn less than $50,000 a year are less likely to say they can rely on their family to be there in their time of need than those who earn $50,000 a year or more (66 percent vs. 75 percent). Women and men hold similar views on how much they can rely on family when in need.
Overall, confidence in family support applies most to spouses or partners. Asked specifically about the help support systems might provide as they age, nearly 8 in 10 (77 percent) of those living with a spouse or partner say they think their significant other will provide a great deal or quite a bit of help as they age. Among those with children, fewer than half (45 percent) say they expect a great deal or quite a bit of help from their children or grandchildren. About a third (32 percent) of Americans 40 or older think their extended family members will provide this level of help as they age.
Men and women are equally as likely to say their spouses will provide them with a great deal or quite a bit of help as they age. Yet reflecting the earlier finding that family caregivers are most likely to care for mothers, women are much more likely than men to think that their children or grandchildren (52 percent vs. 37 percent) or extended family members (37 percent vs. 25 percent) will help them quite a bit or a great deal.
Perceived level of help various support systems will provide as Americans age
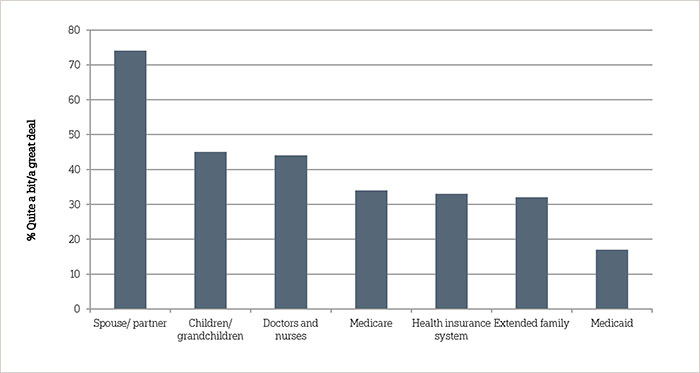
Question: Now I am going to read a list of support systems that might provide help for you as you age. How much help do you think [ITEM] will provide to you as you age…
Expectations about support from the health care industry vary depending on the source. Forty-four percent say doctors, nurses, and other health care providers will provide them with a great deal or quite a bit of help. Fewer think they will be able to rely on Medicare (34 percent), the health insurance system (33 percent), or Medicaid (17 percent).
Those who have received or are currently receiving ongoing living assistance are more likely to think both Medicare and Medicaid will be a greater help to them than those who have never received ongoing living assistance. Forty-nine percent of Americans 40 or older who have received care say Medicare will provide quite a bit or a great deal of help; 32 percent say the same about Medicaid. These numbers fall to 32 percent and 15 percent for Medicare and Medicaid, respectively, for those who have never received ongoing living assistance.
The perception that Medicare can be relied on increases with age. Those 65 or older (47 percent) are more likely than those age 55-64 (36 percent) or 40-54 (23 percent) to say that Medicare will provide them quite a bit or a great deal of help as they age. Democrats are more likely than Republicans to think both Medicare (38 percent vs. 30 percent) and Medicaid (19 percent vs. 10 percent) will help them quite a bit or a great deal. Over 4 in 10 unemployed Americans (43 percent) believe Medicaid will be a source of help, compared to 24 percent of those working full-time or part-time. Views about help from support systems are mostly consistent between the current and 2013 studies. Expectations about help from Medicare did shift 6 points, however: in 2013, 28 percent said Medicare would provide a great deal or quite a bit of help, compared to 34 percent in 2014.
Looking ahead, Americans expect loved ones to need care, but those responsible do not feel prepared to provide that assistance.ꜛ
Not only do a large proportion of Americans 40 or older have current or past experience with long-term care, but a sizable proportion anticipate that their loved ones will need care in the future, and that they might be responsible for providing that care. Similar to findings in the 2013 survey, overall, 3 in 10 Americans 40 or older think it is very or extremely likely that an aging family member or close friend will need ongoing living assistance in the next five years; an additional 3 in 10 think that it is somewhat likely. Thirty-seven percent indicate that it is not too or not at all likely. Americans 40 or older who are married (65 percent) are more likely than those who are not (51 percent) to think a family member or friend is at least somewhat likely to need ongoing living assistance.
Among those who think a family member or close friend might require long-term care, 32 percent think they will be personally responsible for providing that care, 57 percent think that someone else will provide that care, and 6 percent think it will be some combination of the two.
Perceptions of who will be responsible for providing ongoing living assistance to an aging family member or friend
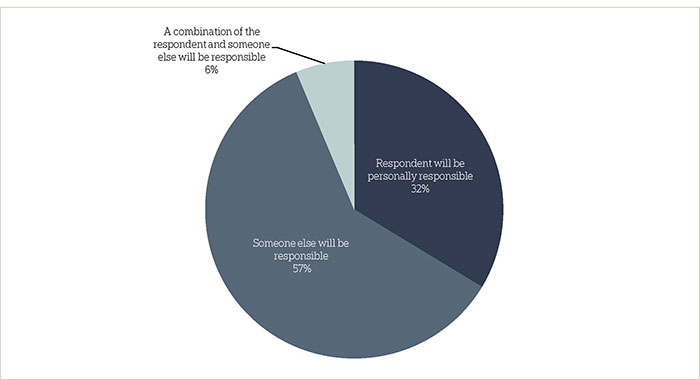
Question: Do you think you, personally, will be responsible for providing that ongoing living assistance, or will someone else be providing that care?
Age affects whether people think they will be responsible for providing care to a family member or friend. Forty percent of Americans age 40 to 54 think they will be responsible, compared to 26 percent of those 55 to 64 and 25 percent of those 65 and older.
Yet, Americans are not particularly confident about their preparedness as caregivers. Among those who expect to provide at least some of the care family members or close friends might need, 3 in 10 consider themselves either very or extremely prepared to provide that care, 51 percent feel somewhat prepared, and 18 percent feel either not too or not prepared at all.
And in practice, when asked whether they had taken specific actions to plan for ongoing living assistance for a family member’s or friend’s needs, few reported doing so. Four in 10 Americans 40 or over say they have discussed their family member or close friend’s preferred types of living assistance, 37 percent say they discussed preferences for where their family member or close friend wants to live while receiving ongoing living assistance, and 22 percent say they helped a family member or close friend make a financial plan to pay for their ongoing care.
Actions taken to plan for ongoing living assistance for a family member or close friend
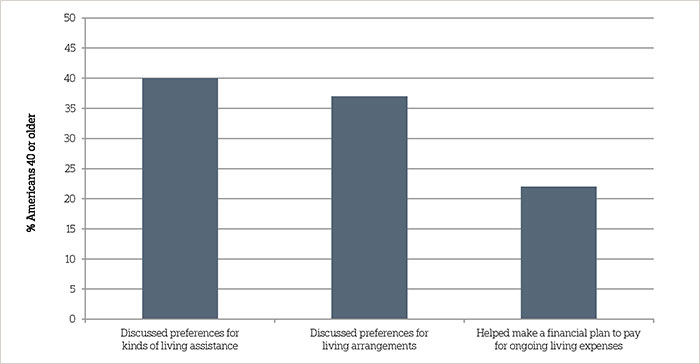
Question: Have you taken any of the following actions to plan for your family member’s or friend’s needs, or not?
The propensity to take actions in planning for a family member or friend’s needs varies across demographic groups. Women are more likely than men to have discussed the kinds of ongoing living assistance and living arrangements the person needing care might prefer (44 percent vs. 32 percent on kinds of living assistance, 41 percent to 32 percent on living arrangements). Americans 40 or older in higher-income households are more likely than those in lower-income households to help make a financial plan for living expenses (26 percent to 17 percent, respectively) and discuss preferences for living arrangements (46 percent to 29 percent, respectively). Experience with long-term care, either as a caregiver or a recipient of care, increases the likelihood that an individual has taken any of these planning actions.
A number of measures are considered helpful for improving the quality of ongoing living assistance, especially those focused on independence and quality of life.ꜛ
When considering ways to improve the quality of ongoing living assistance, Americans 40 or older support a variety of approaches. A large majority (82 percent) think it would be extremely or very helpful to provide access to services in the community that help people continue to live independently. Seventy-seven percent feel this way about ensuring that all care is focused on the person’s quality of life as well as length of life. Majorities also support providing affordable care programs that give the family caregiver the opportunity to take breaks from caregiving (75 percent), letting a family member take time away from work or adjust their work schedule (72 percent), taking into account the person’s personal goals and preferences (68 percent), designating a caregiver on the medical chart, who must be included in all discussions about care (65 percent), and assigning a single case manager who can coordinate all aspects of a person’s care (62 percent).
Attitudes toward measures intended to improve the quality of long-term care services
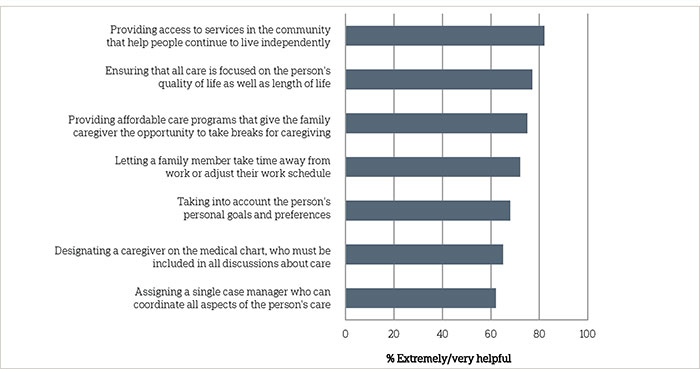
Question: I am going to read a list of ways some people say the quality of ongoing living assistance services could be improved. For each of the following, please indicate how helpful you think each item would be in improving the quality of ongoing living assistance for those in need of care.
Though the proportion considering these measures helpful is sizable across demographic groups, women tend to rate all of these measures as more helpful than men, and Democrats rate all as more helpful than Republicans. Blacks, moreover, rate several measures as being more helpful than Hispanics and whites, including providing affordable care programs that allow the family caregiver to take breaks, letting a family member take time away from work or adjust their work schedule, and assigning a single case manager who can coordinate all aspects of a person’s care.
Majorities of Americans 40 or older with long-term care experience (either receiving or providing care) agree that each of these measures would improve the quality of long-term care for those in need. Regarding the measures “ensuring care is focused on quality of life” and “assigning a case manager for a person’s care”, some small differences emerge between those with and without experience. Those with long-term care experience are more likely than those without to think it would be helpful to ensure all care is focused on the person’s quality of life as well as length of life (80 percent vs. 73 percent) and to assign a single case manager who can coordinate all aspects of a person’s care (66 percent vs. 57 percent).
Compared to last year, Americans are currently more in favor of a government-administered long-term care insurance program, and majorities support other policy proposals to address the costs of long-term care.ꜛ
The 2013 long-term care study showed that Americans 40 or older supported a number of policy proposals to help individuals pay for the costs of ongoing living assistance. This year, the survey tracked three of the same policy proposals, and also asked about two additional proposals. On one long-term care policy proposal, opinion did shift. Nearly 6 in 10 Americans 40 and older (58 percent) now favor a government administered long-term care insurance program similar to Medicare, representing a 7-point increase from 51 percent in 2013. The shift in support spans a number of demographic groups, but is most pronounced among blacks (up 21 points from 2013 to 77 percent), those with a household income under $50,000 (up 13 points to 65 percent), and men (up 9 points to 57 percent).
Americans 40 or older remain broadly supportive of tax breaks to encourage saving for long-term care—81 percent favor such a program, on par with the 77 percent who expressed support in 2013. On the other hand, Americans continue to reject the idea of requiring individuals to purchase private long-term care insurance. Just one-third (34 percent) of Americans 40 or older favor a requirement that individuals purchase private long-term care insurance.
Seventy-seven percent say they favor tax breaks for consumers who purchase long-term care insurance, and 75 percent favor allowing individuals to purchase long-term care insurance through their employer that is portable if they pay the premium after they leave the job, similar to COBRA.
Support for policy proposals to prepare for the costs of ongoing living assistance
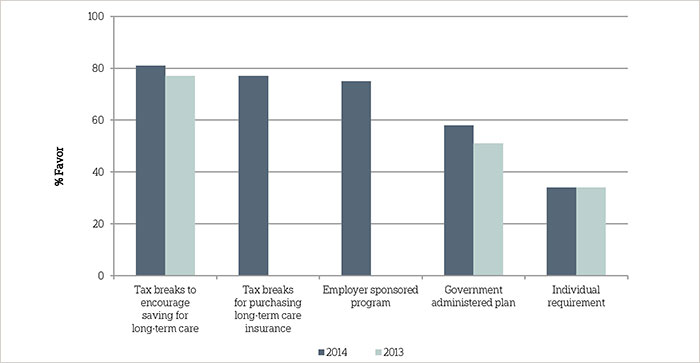
Question: To help Americans prepare for the costs of ongoing living assistance, sometimes referred to as long-term care, would you favor, oppose, or neither favor nor oppose …?
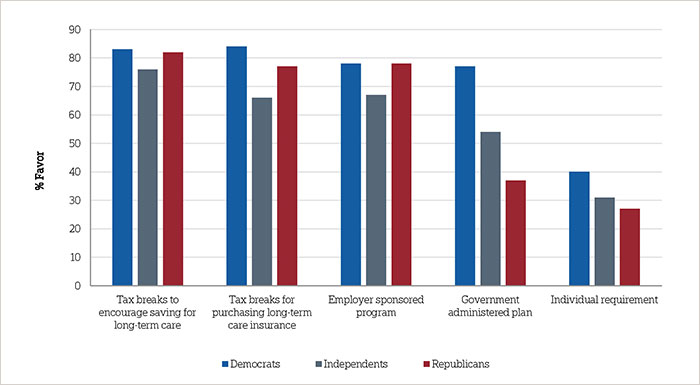
Similar to the 2013 study, support for long-term care policy proposals differs along party lines. Democrats (77 percent) and independents (54 percent) are more likely than Republicans (37 percent) to support a government administered long-term care insurance program. Democrats are also more likely than Republicans to support a requirement that individuals purchase private long-term care insurance (40 percent vs. 27 percent). Democrats are the most likely to support tax breaks for consumers who purchase long-term care insurance (84 percent) followed by Republicans (77 percent) and independents (66 percent).
On one policy proposal Democrats and Republicans are more aligned with each other than they are with independents. On the question of whether individuals should be able to purchase long-term care insurance through their employer, Democrats and Republicans (78 percent each) are more likely to favor the idea than independents (67 percent). At similar levels, Americans across parties support tax breaks to encourage saving for ongoing living assistance expenses.
Support for long-term care policies by political party affiliation
Caregivers, and recipients of long-term care, hold similar views about each of the five policy proposals asked in the survey compared to those without personal experience with long-term care.
In a separate question, Americans 40 or older were asked who should be responsible for paying the costs of ongoing living assistance. A majority of Americans 40 or older (54 percent) say health insurance companies should have a large or very large responsibility for these costs. Fewer say Medicare (42 percent), individuals (40 percent), and Medicaid (38 percent) should be responsible for coving the costs of ongoing living assistance. Just one-fifth (19 percent) say families be responsible for covering the costs of ongoing living assistance.
Experience with long-term care—either as a caregiver or recipient of care—does not affect views about who should be responsible for paying for the costs of ongoing living assistance. Caregivers and recipients of care agree that health insurance companies should be most responsible for the costs, that families should be least responsible, and Medicare, individuals, and Medicaid fall somewhere in between. However, the seven percent of those 40 and older who are paying for long-term care are more likely than others to think Medicare, Medicaid, and health insurance companies should be responsible for ongoing living assistance costs.
Who Americans 40 or older believe should be responsible for covering ongoing living assistance costs
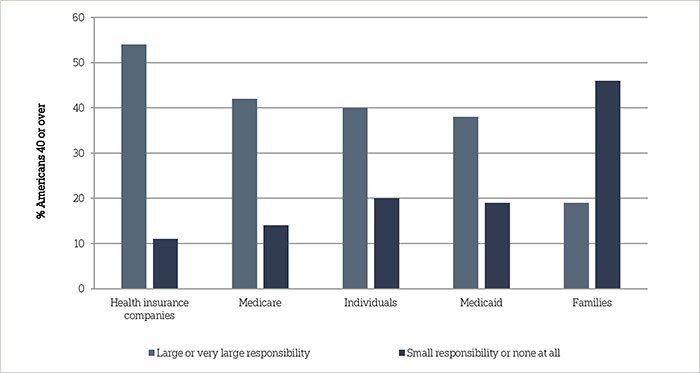
Question: Thinking about who should be responsible for paying for the costs of ongoing living assistance…How much responsibility should [ITEM] have for paying for the costs of ongoing living assistance?
Opinions about responsibility vary across a number of demographic groups. Americans age 40-54 are more likely than those age 65 or older to say that Medicare (45 percent vs. 36 percent), Medicaid (42 percent vs. 31 percent), and health insurance companies (61 percent vs. 44 percent) should have a large or very large responsibility to pay for ongoing living assistance. Americans 55-64 are also more likely than those 65 and older to say Medicaid and health insurance companies should have responsibility. There are also differences across income groups: those with household incomes of $50,000 or more are more likely than those with household incomes of less than $50,000 to say individuals (49 percent vs. 31 percent) and families (25 percent vs. 14 percent) should have a large or very large responsibility to pay for ongoing living assistance, and less likely to say that Medicare (33 percent vs. 51 percent), Medicaid (34 percent vs. 43 percent), and health insurance companies (49 percent vs. 60 percent) should have a large or very large responsibility to pay for ongoing living assistance.
Partisan divides also persist in the perceptions about who should be responsible for paying for ongoing living assistance, with Democrats more apt to say institutional actors ought to bear the burden while Republicans see it more as the responsibility of individuals or families. Democrats are more likely than independents and Republicans to say that Medicare (49 percent vs. 39 percent vs. 33 percent, respectively) and Medicaid (45 percent vs. 38 percent vs. 29 percent, respectively) should have a large or very large responsibility for paying for the costs of ongoing living assistance. Republicans are more likely than independents and Democrats to say that individuals (52 percent vs. 36 percent vs. 32 percent, respectively) and families (27 percent vs. 15 percent vs. 14 percent, respectively) should have a large or very large responsibility for paying for the costs of ongoing living assistance.
Americans lack confidence they are prepared financially for their own long-term care; most misperceive the cost of care and Medicare’s role.ꜛ
Just 29 percent of Americans 40 or older say they are extremely or very confident they will have the financial resources to pay for any needed care as they age, 38 percent are somewhat confident, and 32 percent are not too or not confident at all. Insured Americans are more likely than uninsured Americans to say they are confident (31 percent vs. 12 percent). Those with household income of at least $50,000 are nearly twice as likely as those with a household income of less than $50,000 (39 percent vs. 20 percent) to say they are confident.
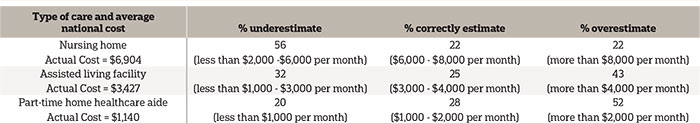
Asked to estimate the national average monthly cost of living in a nursing home, assisted living facility, or to receive in-home care from a part-time healthcare aide, Americans 40 or older demonstrate widespread misperceptions of the actual cost of these services.2 Americans tend to underestimate the average monthly cost to live in a nursing home, with 56 percent saying it costs less than $6,000. And Americans tend to overestimate the average monthly cost to live in an assisted living community, with 43 percent citing monthly costs greater than $4,000. Americans also overestimate the average monthly cost of a two hour daily visit from a home healthcare aide, with 52 percent saying it costs more than $2,000. The percentage underestimating the cost of a home healthcare aide has risen 6 points to 20 percent, up from 14 percent in 2013.
Perceived costs of long-term care providers3
Americans 40 or over also continue to overestimate the long-term care services that Medicare will cover. Generally, Medicare pays for skilled nursing facility stays in only certain circumstances, and for brief periods of time.4 Yet, 42 percent believe that Medicare pays for ongoing care in a nursing home facility, and 38 percent believe the Medicare pays for ongoing care at home by a licensed home healthcare aide. These findings are roughly equivalent to the 2013 study (37 percent and 44 percent, respectively). Two-thirds of Americans believe that Medicare pays for medical equipment such as wheelchairs and other assistive devices, which is true if a physician prescribes this equipment as medically necessary.
Medicaid, a government health care coverage program for low income people and people living with certain disabilities, is the single largest payer for long-term care services in the United States.5 Though two-thirds of Americans 40 or older lack confidence that they will have sufficient financial resources to pay for such services as they age, 53 percent say they do not think they will need Medicaid to help pay for ongoing living assistance expenses as they age.
Americans 40 or older without health insurance coverage are more likely than those with health insurance coverage to say they will need Medicaid to help pay for ongoing living assistance expenses (69 percent vs. 36 percent). Americans age 40-54 (44 percent) and Americans 55-64 (45 percent) are more likely than Americans 65 or older (35 percent) to say they will need Medicaid to help pay for ongoing living assistance expenses. Blacks (66 percent) and Hispanics (58 percent) are much more likely than whites (33 percent) to say they think they will need Medicaid to help pay for ongoing living assistance expenses.
Most people are not getting information about long-term care and those who do, most often get it from friends, family, or co-workers. ꜛ
Less than half of Americans 40 and older (46 percent) say that they have received information about ongoing living assistance within the last 12 months from any of the nine information sources covered by the survey. Those who have received any information in the last year report receiving it from an average of two sources out of the nine covered.
Among those who have received information about ongoing living assistance from at least one of these sources, the most popular source is from one’s own social circle. Forty-five percent of those who have received information in the past year say they have gotten information from friends, family, or coworkers. Smaller proportions report receiving information from Medicare (30 percent), a nursing home or assisted living facility (28 percent), private insurers (27 percent), a financial planner or accountant (27 percent), their family physicians (20 percent), Medicaid (17 percent), an emergency room physician (13 percent), and their employers (10 percent).
When weighing the information provided by these various sources, Americans 40 or older are most trusting of information obtained from their family physicians. Two-thirds of those who received information from family physicians report that they trust that information very much or completely. More than half (57 percent) trust information provided by financial planners or accountants to the same degree. Fifty-three percent trust long-term care information provided by friends, family, or coworkers, and 50 percent trust information from their employers.
Fewer than half trust information from emergency room physicians (49 percent), Medicare (45 percent), Medicaid (43 percent), nursing homes or assisted living facilities (37 percent) and private insurers (29 percent).
Trust in information about ongoing living assistance
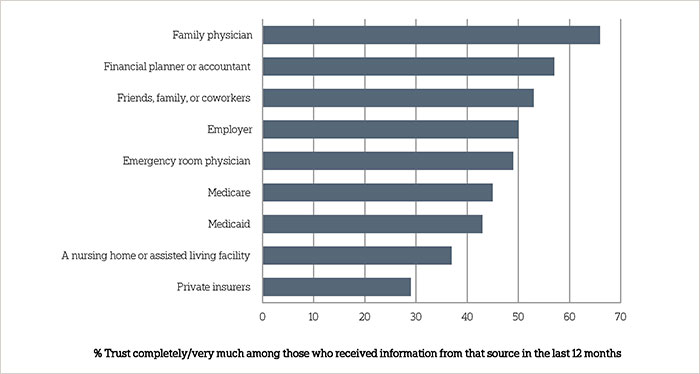
Question: When you get information about ongoing living assistance from [ITEM], how much do you trust the information they provide?
Majorities expect to need care themselves in the future, but are more likely to plan for their funeral than for ongoing living assistance.ꜛ
Overall, 6 in 10 Americans 40 years or older—and who are not currently receiving ongoing living assistance—believe it is at least somewhat likely that they will require ongoing living assistance someday. Fewer than 4 in 10 (36 percent) think it is not too or not likely at all. These perceptions have changed little since the 2013 study. Last year, 24 percent of Americans felt it was extremely or very likely they would need ongoing living assistance someday, 41 percent felt it was somewhat likely, and 32 percent felt it was not too likely or not likely at all.
Americans 40 or older who have provided ongoing living assistance to a family member or close friend are more likely than those who have not to think it is likely they will personally need ongoing living assistance at some point (23 percent vs. 16 percent). Women are more likely than men to say they will need ongoing living assistance sometime in the future (24 percent vs. 16 percent).
Despite Americans’ widespread belief that they will need care later in life, very few report planning for their own ongoing living assistance needs. Just 13 percent of Americans 40 or older report doing a great deal or quite a bit of planning for their own care needs, 19 percent have done a moderate amount of planning, and 67 percent report doing little or no planning at all. These results are almost identical to the 2013 findings.
A number of factors are associated with the likelihood of planning for ongoing living assistance, including age, income, and having ever received ongoing living assistance in the past. Nineteen percent of Americans 65 or older report doing a great deal or quite a bit of planning compared to 9 percent of 40 to 54 year olds. Americans in households earning $100,000 per year or more are much more likely than those earning less to report planning for their own care.
Delving deeper into specific planning actions related to aging, Americans 40 or older are more likely to plan for their death than for the needs they might require while they are living. Asked if they have discussed preferences for their funeral arrangements with someone they trust, nearly two-thirds of Americans 40 or older (65 percent) report doing so. A majority (53 percent) also report that they have created an advanced directive or living will. Fewer than half (41 percent) have discussed their preferences for ongoing living assistance. Even fewer have set aside money to pay for ongoing living assistance (32 percent), modified their home to make it easier to live in as they age (28 percent), looked for information about aging issues and ongoing living assistance (20 percent), or moved to a living facility designed for older adults (8 percent).
How Americans 40 and older are planning for their ongoing care needs
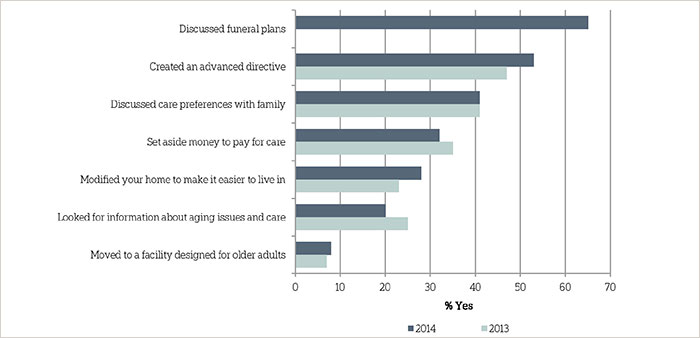
Question: What actions have you taken to plan for your own needs as you age? Have you (ITEM) or not?
Not surprisingly, recipients of care are more likely than those who have not received care to have done a number of specific long-term care planning activities. One exception, however, is on the question about setting aside money to pay for care: care recipients are just as likely as others to have set aside money to pay for ongoing living assistance, with about a third in each group reporting they have done so. Care providers are more likely than those who have not provided care say they have done a number of planning activities for themselves, including discussing preferences for the kinds of ongoing living assistance they want with their family, looking for information about aging issues and modifying their home to make it easier to live in as they grow older.
Although Americans are anxious about having to rely on others as they age, few are concerned about planning enough for long-term care.ꜛ
Americans 40 or older express concern about a variety of challenges they might face as they age. A slight majority (51 percent) say they have quite a bit or a great deal of concern about losing their independence and having to rely on others. Sizable shares are also concerned about losing their memory or other mental abilities (50 percent) and being able to pay for the care or help they might need (45 percent).
On the other hand, Americans 40 or older are generally less worried about how much they have planned for their own long-term care. About a third (34 percent) express quite a bit or a great deal of concern about not planning enough for the care they might need when they get older. Twenty-eight percent say they are moderately concerned, while 38 percent cite only a little or no concern at all. Those who have ever received or are currently receiving ongoing living assistance show higher levels of concern about not planning enough for care (44 percent quite a bit or a great deal) than those who have never received such assistance (32 percent).
Fewer than half (45 percent) of Americans 40 or older are concerned with paying for care as they age. Even though many types of health care insurance plans do not cover the costs of long-term care, Americans who are currently covered are less likely than those who are not covered to say they are quite a bit or a great deal concerned about being able to pay for care (42 percent vs. 64 percent). They are also less likely to express high levels of concern about not planning enough for care they might need (31 percent vs. 50 percent).
Americans’ concern with personal situation as they age
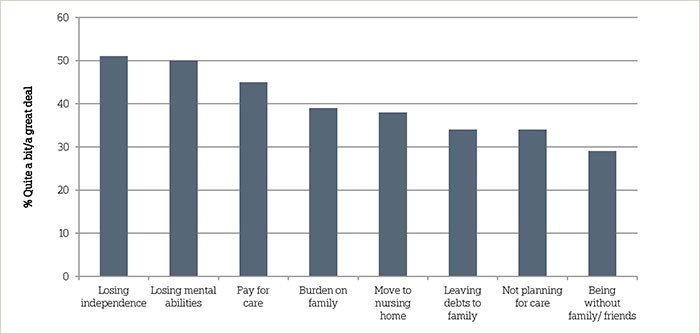
Question: Thinking about your own personal situation as you get older, for each item please tell me if it causes you a great deal of concern, quite a bit of concern, a moderate amount, only a little, or none at all?
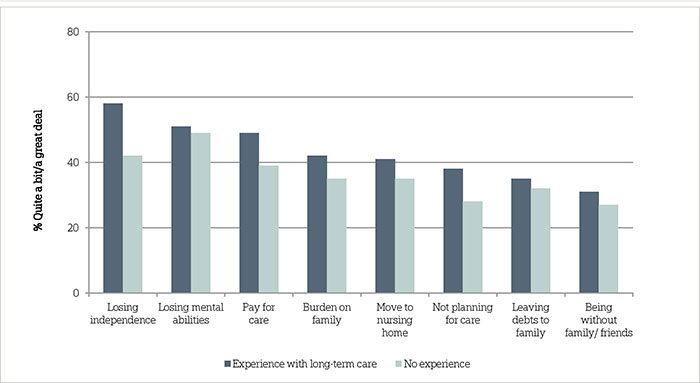
Nearly 4 in 10 Americans (39 percent) say they are deeply concerned about being a burden on their families as they grow older. Concern is more pronounced among those who live in the same home with extended family members, beyond spouses, partners, or children. Forty-five percent in that group expressed quite a bit or a great deal of concern about being a burden compared to 36 percent of those who do not live with extended family. There are no distinct differences between those who are married, and those who have children at home, and concern about being a burden on one’s family.
Thirty-eight percent of Americans 40 or older are concerned with having to go to a nursing home, 34 percent are concerned with leaving debts to family, and 29 percent express concern with being alone without family or friends around them. A majority (54 percent) say they have only a little or no concern at all about leaving debts to their family; across all of the concern items tested, this was the only item in which a majority express only a little or no concern about the particular aspect of aging. Those who currently live with extended family show higher levels of concern about being alone without family and friends around them. About 4 in 10 (39 percent) say they are quite a bit or a great deal concerned, compared to 24 percent who do not live with family. Those who are married or who have children at home, however, hold similar levels of concern about being alone.
Experience with ongoing living assistance—either providing it to someone else or receiving it themselves—increases some concerns about the difficulties of growing older. Americans who have such experience are more likely than those who do not to express concern about losing their independence (58 percent vs. 44 percent), being able to pay for care (49 percent vs. 40 percent), and not planning enough for the care they might need (37 percent vs. 29 percent). They are also more likely to express a great deal of concern in particular about being a burden on their families (33 percent vs. 24 percent), having to leave their home and move into a nursing home (32 percent vs. 24 percent), and being alone without family and friends around them (24 percent vs. 16 percent).
Concern with aspects of aging by experience with long-term care
Question: Thinking about your own personal situation as you get older, for each item please tell me if it causes you a great deal of concern, quite a bit of concern, a moderate amount, only a little, or none at all?
Concerns about growing older appear to abate somewhat with age. Those age 40-54 are more likely to express concern about being able to pay for care as they grow older (53 percent) than those age 55-64 (42 percent) or age 65 or older (36 percent). A similar pattern emerges relating to concern for leaving debts to one’s family, where 41 percent age 40-54 express quite a bit or a great deal of concern compared to just 32 percent of those age 55-64 and 26 percent of those age 65 or older.
Concern with aspects of aging also varies across racial and ethnic groups. Just of half (52 percent) of blacks age 40 or older also say they are quite a bit or a great deal concerned about being a burden on their families, while only 38 percent of whites feel this way. Blacks (54 percent) and Hispanics (61 percent) are more likely than whites (40 percent) to express high levels of concern about being able to pay for care or help as they grow older. Blacks are also more likely than whites to express concern with not planning enough for care they might need in the future (53 percent vs. 29 percent).
Lower-income Americans age 40 or older are more concerned about many of the difficulties of growing older compared to higher earners. In contrast to those earning $50,000 or more, those with lower incomes (below $50,000 a year) are more likely to say they are quite a bit or a great deal concerned about losing independence and having to rely on others (59 percent vs. 44 percent), being able to pay for care or help they might need (56 percent vs. 33 percent), being a burden on their families (45 percent vs. 33 percent), not planning enough for care they might eventually need (45 percent vs. 24 percent), having to leave their homes for a nursing home (44 percent vs. 33 percent), and leaving debts to their families (41 percent vs. 27 percent).
Women age 40 or older generally report more concern about some of the difficulties with getting older than men. They are more likely to say they are concerned about losing their independence and having to rely on others (57 percent vs. 45 percent), losing their memory or other mental abilities (56 percent vs. 43 percent) and being a burden on their families (44 percent vs. 33 percent).
About the Studyꜛ
Study Methodology
This survey, funded by The SCAN Foundation, was conducted by the Associated Press-NORC Center for Public Affairs Research between the dates of March 13 through April 23, 2014. Staff from NORC at the University of Chicago, the Associated Press, and The SCAN Foundation collaborated on all aspects of the study.
This random-digit-dial (RDD) survey of the 50 states and the District of Columbia was conducted via telephone with 1,419 adults age 40 and older. In households with more than one adult 40 or older, we used a process that randomly selected which eligible adult would be interviewed. The sample included 1,014 respondents on landlines and 405 respondents on cell phones. The sample also included an oversample of Californians 40 years and older. The sample includes 485 residents of California ages 40 and older. Cell phone respondents were offered a small monetary incentive for participating, as compensation for telephone usage charges. Interviews were conducted in both English and Spanish, depending on respondent preference. All interviews were completed by professional interviewers who were carefully trained on the specific survey for this study.
The RDD sample was provided by a third-party vendor, Marketing Systems Group. The final response rate was 22 percent, based on the American Association of Public Opinion Research (AAPOR) Response Rate 3 method.
Sampling weights were calculated to adjust for sample design aspects (such as unequal probabilities of selection) and for nonresponse bias arising from differential response rates across various demographic groups. Poststratification variables included age, sex, race, region, education, and landline/cell phone use. The weighted data, which thus reflect the U.S. population, were used for all analyses. The overall margin of error was +/- 3.6 percentage points, including the design effect resulting from the complex sample design.
All analyses were conducted using STATA (version 13), which allows for adjustment of standard errors for complex sample designs. All differences reported between subgroups of the U.S. population are at the 95 percent level of statistical significance, meaning that there is only a 5 percent (or less) probability that the observed differences could be attributed to chance variation in sampling. Additionally, bivariate differences between subgroups are only reported when they also remain robust in a multivariate model controlling for other demographic, political, and socioeconomic covariates. A comprehensive listing of all study questions, complete with tabulations of top-level results for each question, is available on the AP-NORC Center for Public Affairs Research long-term care website: www.longtermcarepoll.org.
Contributing Researchers
From NORC at the University of Chicago
Jennifer Benz
Nicole Willcoxon
Rebecca Reimer
Dan Malato
Emily Alvarez
Matthew Courser
Trevor Tompson
From The Associated Press
Jennifer Agiesta
Dennis Junius
About the Associated Press-NORC Center for Public Affairs Research
The AP-NORC Center for Public Affairs Research taps into the power of social science research and the highest-quality journalism to bring key information to people across the nation and throughout the world.
- The Associated Press (AP) is the world’s essential news organization, bringing fast, unbiased news to all media platforms and formats.
- NORC at the University of Chicago is one of the oldest and most respected, independent research institutions in the world.
The two organizations have established The AP-NORC Center for Public Affairs Research to conduct, analyze, and distribute social science research in the public interest on newsworthy topics, and to use the power of journalism to tell the stories that research reveals.
The founding principles of The AP-NORC Center include a mandate to carefully preserve and protect the scientific integrity and objectivity of NORC and the journalistic independence of AP. All work conducted by the Center conforms to the highest levels of scientific integrity to prevent any real or perceived bias in the research. All of the work of the Center is subject to review by its advisory committee to help ensure it meets these standards. The Center will publicize the results of all studies and make all datasets and study documentation available to scholars and the public.
Footnotesꜛ
1. Ongoing living assistance was defined for respondents as “assistance can be help with things like keeping house, cooking, bathing, getting dressed, getting around, paying bills, remembering to take medicine, or just having someone check in to see that everything is okay. This help can happen at your own home, in a family member’s home, in a nursing home, or in a senior community. And, it can be provided by a family member, a friend, a volunteer, or a health care professional.” ꜛ
2. Respondents from California were asked a different version of this question and are excluded from analysis. ꜛ
3. Based on John Hancock’s Cost of Care Study, conducted by LifePlans, Inc., 2013. The national average monthly base rate in an assisted living facility was $3,427 in 2013. The national average hourly rate for home health aides was $19. Part-time calculated at 2 hours per day for a 30 day month at $19 per hour = $1,140 per month. The national daily average of a semi-private nursing home room is $227. Monthly is calculated at $227*365 days/12 months. ꜛ
4. Genworth 2013 Cost of Care Survey. Home Care Providers, Adult Day Health Care Facilities, Assisted Living Facilities and Nursing Homes. https://www.genworth.com/dam/Americas/US/PDFs/Consumer/corporate/130568_032213_Cost%20of%20Care_Final_nonsecure.pdf. Accessed May 14, 2014. ꜛ
5. United States Department of Health and Human Services. Who Pays for Long-term Care? http://longtermcare.gov/the-basics/who-pays-for-long-term-care/. Accessed May 14, 2014. ꜛ