
© 2017 iStock/Obencem
By age 40, a third of Americans are already long‑term caregivers for a loved one, and a third expect to become caregivers in the next five years, according to a new study of Americans age 18 and older by The Associated Press‑NORC Center for Public Affairs Research. The study reveals that while younger adults are just as likely as those age 40 and older to expect to be a caregiver soon, they feel much less prepared for the job. It also finds that adults age 18 to 39 are skeptical of the longevity of social safety net programs. Just 1 in 10 are confident that Social Security, Medicare, and Medicaid will maintain their level of benefits when it comes time for them to need these programs.
The majority of Americans age 65 and older will require at least some long‑term care; that is, support with activities of daily living—things like cooking, bathing, or remembering to take medicine.1 To continue its study into the long‑term care experiences of American families, The AP‑NORC Center conducted its sixth annual Long‑Term Care Poll in 2018. Prior years of the poll focused on Americans age 40 and older. For the first time, this year’s study also explores the perspectives of younger adults, those age 18 to 39, generating new insights on their personal experiences with caregiving and their views of long‑term care. Throughout this report, those age 18 to 39 are referred to as younger adults.
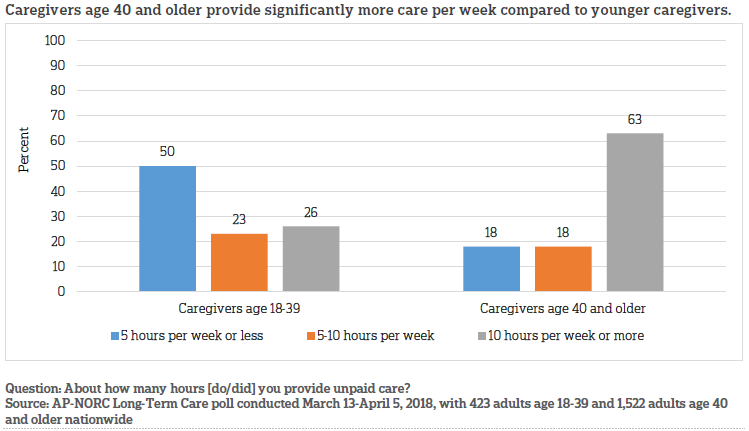
These younger caregivers, age 18‑39, differ from caregivers age 40 and older in several ways. Younger caregivers spend fewer hours providing care compared to caregivers age 40 and older, who are more than twice as likely to spend 10 or more hours a week providing unpaid care (26 percent vs. 63 percent). Although they spend less time providing care, younger caregivers are more likely to report being at least moderately stressed by caregiving (80 percent) than are caregivers age 40 and older (67 percent). While caregivers age 40 and older are disproportionately female compared to the overall population (59 percent female vs. 41 percent male), this is not true of younger caregivers, who are just as likely to be male (48 percent female vs. 52 percent male).
As a buffer to this stress, younger adult caregivers rely on a variety of sources for social and emotional support and generally feel supported in their caregiving role. Fifty‑eight percent say they receive most of the support they need and 29 percent say they receive some support, but 12 percent say they receive hardly any or no support. Younger caregivers and those age 40 and older report receiving similar levels of support, but younger caregivers are more likely to get support from their families than are caregivers age 40 and older (51 percent vs. 37 percent).
The 2018 poll finds that although younger adults are many more years away from needing care themselves, their perceptions of long‑term care are quite similar to the perceptions of adults age 40 and older. Many Americans are unaware of the prevalence of long‑term care. Minorities of both younger adults and adults age 40 and older can correctly estimate that about 7 in 10 older Americans will need long‑term care (29 percent vs. 35 percent). Similarly, few adults expect there will be a day when they will need long‑term care services themselves. Just 22 percent of both younger adults and adults age 40 and older believe it is very likely that they will personally need long‑term care services. Moreover, less than half have taken any action to plan for an older loved one’s long‑term care needs, and this is true of both younger adults and adults age 40 and older.
Many older Americans expect social safety net programs, such as Medicare, Medicaid, and Social Security, to cover most of the costs of long‑term care.2 This study finds that younger adults are skeptical of the longevity of these social safety net programs. Just 1 in 10 are very confident that Medicare, Medicaid, and Social Security will provide the same level of benefits as they do today when it comes time for them to need them. Despite their lack of confidence in these programs, younger adults are less likely than adults age 40 and older to support policies that would help Americans pay for long‑term care services, though a majority do support these policies.
On the other hand, 81 percent of younger adults think that employers should offer employees long‑term care insurance plans as a benefit.
The AP‑NORC Center conducted this study with funding from The SCAN Foundation. The poll includes 1,945 interviews with a nationally representative sample of Americans using the AmeriSpeak® Panel, including 423 adults age 18 to 39 and 1,522 adults age 40 and older.
Key themes and findings from this study are described below:
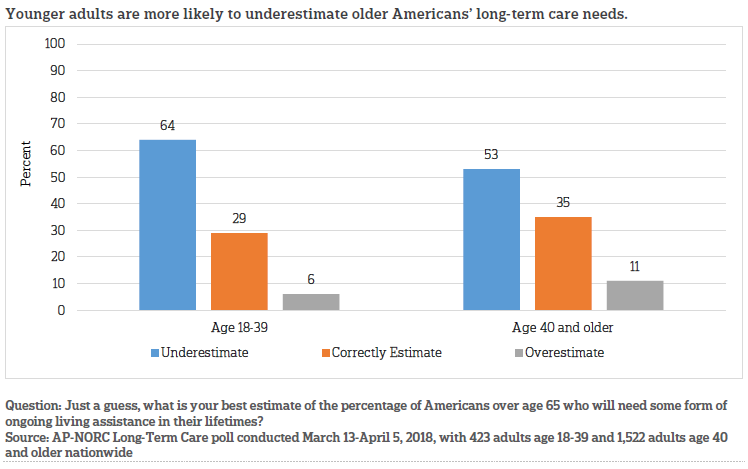
- Sixty‑four percent of those age 18 to 39 underestimate the percentage of Americans over age 65 who will need some form of long‑term care during their lifetime. Twenty‑nine percent correctly estimate that 60‑79 percent of older Americans will need long‑term care. Six percent overestimate long‑term care needs.
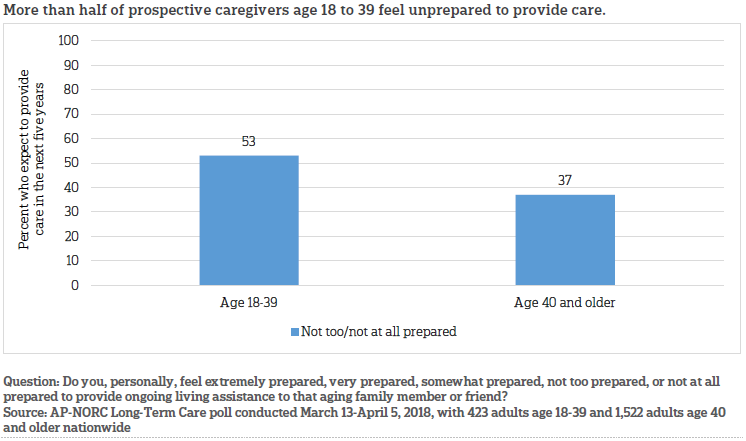
- Of the 34 percent of younger adults who expect to become caregivers in the next five years, a majority (53 percent) say they are not too prepared or not prepared at all to provide that care. Overall, prospective caregivers age 18 to 39 feel less prepared to provide care to a loved one than do those age 40 and older.
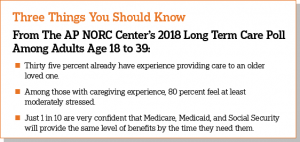
- Thirty‑five percent of adults age 18 to 39 already have experience providing long‑term care to a loved one, either in the past (19 percent) or currently (17 percent). The likelihood of having any caregiving experience is similar to that among adults age 40 and older.
- Among younger caregivers, about a quarter say they provide 10 or more hours of unpaid care per week, while about three quarters say they provide less than 10 hours per week. Compared to caregivers age 40 and older, however, younger caregivers spend fewer hours per week providing care.
- Thirty percent of younger caregivers say providing care is very or extremely stressful, and 50 percent say it is moderately stressful. And, despite providing fewer hours of care, younger caregivers are more likely to report being at least moderately stressed (80 percent) than are caregivers age 40 and older (67 percent).
- Compared to caregivers age 40 and older, those age 18 to 39 are more likely to say they receive a good deal of support from their family (51 percent vs. 37 percent). They are also more likely to report at least some support from faith‑based communities (59 percent vs. 45 percent) or online support communities like social media (45 percent vs. 25 percent).
- When it comes to who should pay for long‑term care, 53 percent of those age 18 to 39 say that private health insurance companies should have a large responsibility. Forty percent say Medicare should have a large responsibility to pay for long‑term care, and 32 percent say the same about Medicaid.
- Fifteen percent of younger adults are confident that Social Security, Medicare, and Medicaid will provide the same level of benefits five years from now that they do today. Younger adults are even less confident when thinking further down the line. Just 1 in 10 are confident that Social Security, Medicare, and Medicaid will maintain their level of benefits when it comes time for them to need these programs.
- Compared with adults age 40 and older, younger adults express lower levels of support for the policy proposals designed to help individuals and caregivers with the costs of long‑term care and are more likely to say they neither favor nor oppose the policies.
- Eighty‑one percent of adults age 18 to 39 think that employers should offer employees long‑term care insurance plans as a benefit, similar to how some employers offer health, dental, or vision insurance.
Additional information, including the survey’s complete topline findings, can be found on The AP‑NORC Center’s long‑term care project website at www.longtermcarepoll.org.
A Majority Of Younger Adults Underestimate The Long-Term Care Needs Of Older Americansꜛ.
Despite the fact that 7 in 10 older Americans will need at least some long‑term care as they age, it is a topic that is foreign to many younger adults.3
Sixty‑four percent of those age 18 to 39 underestimate the percentage of Americans over age 65 who will need some form of long‑term care during their lifetime. Twenty‑nine percent correctly estimate that 60‑79 percent of older Americans will need long‑term care. Six percent overestimate long‑term care needs.
Those age 40 and older aren’t as likely as younger Americans to underestimate long‑term care needs.
Similarly, few adults age 18 to 39 expect there will be a day when they will need long‑term care services themselves. Just 22 percent think it is very likely that they will personally require assistance as they age, while 42 percent say it is somewhat likely. The remainder, 35 percent, believe it is not too likely or not at all likely that they will need care. In this regard, younger adults are similar to adults age 40 and older. Just 22 percent of those age 40 and older believe it is very likely they will need care, while 43 percent believe it is somewhat likely, and 34 percent say it is not too likely or not at all likely.
No matter their age, aging isn’t a topic that people want to think about. Just 18 percent of younger adults and 26 percent of adults age 40 and older feel very comfortable thinking about the idea of getting older. Thirty‑nine percent of younger adults and 29 percent of adults age 40 and older would rather not think about getting older, and 42 percent of younger adults and 44 percent of adults age 40 and older are somewhat comfortable with the idea of aging.
One-Third Of Younger Adults Expect To Provide Care In The Next Five Years And Most Feel Unprepared To Do So.ꜛ
While younger adults underestimate the likelihood that they personally will need care someday, many expect an older friend or family member to need ongoing living assistance in the coming years. Among the 83 percent who are not current caregivers, 26 percent of adults age 18 to 39 say it is very or extremely likely that a loved one will need care in the next five years, while another 36 percent say it is somewhat likely. These expectations are similar to those of adults age 40 and older.
Many of these younger adults expect to be personally involved in providing care—18 percent say they will be responsible, while another 46 percent say they will share the responsibility of caregiving with someone else.
In other words, among the 83 percent of younger adults who are not currently caregivers, 63 percent think an older loved one is at least somewhat likely to need care in the next five years, and 64 percent of those expect to personally be responsible for providing that care, yielding a total of 34 percent of all adults age 18 to 39 who expect to become caregivers in the near future.
Most of the younger prospective caregivers, however, do not feel prepared to provide care. A majority, 53 percent, of adults age 18 to 39 are not prepared to provide care to a loved one, compared to 37 percent of those age 40 and older.
Younger adults who expect to provide care show moderate levels of confidence they will have the social and emotional support they need while providing care. While 30 percent say they are extremely or very confident they will have that support, 38 percent are just somewhat confident and 28 percent are not too or not confident at all. These confidence levels are similar to those among adults age 40 and older.
Among all younger adults, few have taken action to plan for an older friend or family member’s long‑term care needs. Over a quarter have talked with a loved one about where they would want to live while receiving care (27 percent), who they would want to provide that care (28 percent), and their preferences for the kinds of care they do or do not want (29 percent). Overall, 39 percent of younger adults have done any planning, which is similar to planning among adults age 40 and older.
By Age 40, A Third Of Younger Adults Are Already Caregivers, And They Feel The Stress Of The Job.ꜛ
Thirty‑five percent of adults age 18 to 39 already have experience providing long‑term care to a loved one, either in the past (19 percent) or currently (17 percent). These rates of caregiving experience are similar to those for Americans age 40 and older.
Younger adult caregivers look similar demographically to younger adults who do not have caregiving experience. They have similar levels of education, income, marital status, employment, and racial and gender makeups. Younger caregivers differ from older caregivers in this regard, as caregivers age 40 and older are disproportionately female compared to the overall 40 and older population (59 percent vs. 41 percent male).
In terms of the time commitment for younger caregivers, about a quarter say they provide 10 or more hours of unpaid care per week, while about three quarters say they provide less than 10 hours per week. Compared to caregivers age 40 and older, however, younger caregivers spend fewer hours per week providing care. Nearly two‑thirds of caregivers age 40 and older say they provide 10 hours of care a week or more.
Still, many younger caregivers find their caregiving role stressful. Thirty percent say providing care is very or extremely stressful, and 50 percent say it is moderately stressful. And, despite providing fewer hours of care, younger caregivers report stress more often than caregivers age 40 and older. Younger caregivers are more likely to report being at least moderately stressed (80 percent) than are caregivers age 40 and older (67 percent).
Younger caregivers generally feel supported in their caregiving role, though. Fifty‑eight percent say they receive most or all of the social and emotional support they need to provide care, while another 29 percent say they receive some of the support they need. Twelve percent say they received hardly any or none of the support they needed.
Caregivers age 18 to 39 get social and emotional support from a variety of places—friends, health care providers, faith‑based organizations, government programs, online communities—but the most common source is their family.
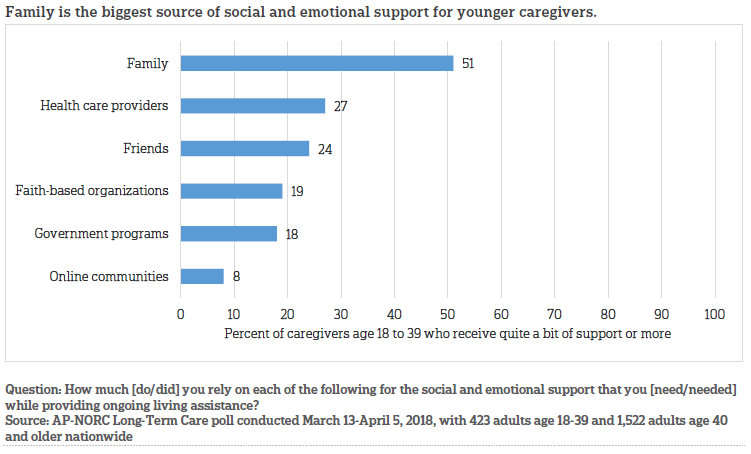
While younger caregivers and caregivers age 40 and older report similar levels of support overall, where they get that support differs. Caregivers age 18 to 39 are more likely to say they receive a good deal of support from their family (51 percent vs. 37 percent). They are also more likely to report any support from faith‑based communities (59 percent vs. 45 percent) or online support communities like social media (45 percent vs. 25 percent).
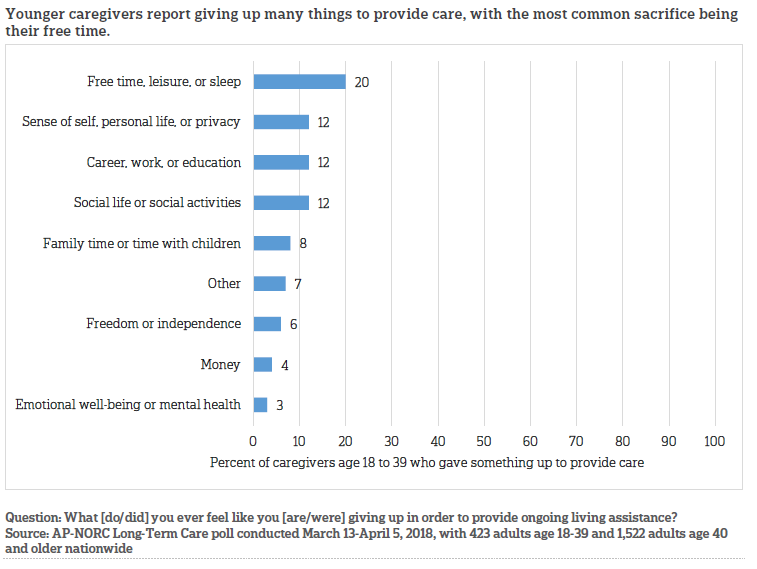
Many younger caregivers feel that providing care to a loved one has been a sacrifice. Six in 10 feel they gave something up to provide care. Among those for whom caregiving has involved making sacrifices, the most common things they feel like they gave up were free time (20 percent), their own personal life, their career or education, and social activities (12 percent each).
Most Younger Adults Are Skeptical That Social Safety Net Programs Will Be There When It Comes Time For Them To Need Long-Term Care.ꜛ
When it comes to who should pay for long‑term care, 53 percent of younger adults age 18 to 39 say that private health insurance companies should have a large responsibility. Slightly fewer think traditional social safety net programs should be responsible. Forty percent say Medicare should have a large responsibility to pay for long‑term care, and 32 percent say the same about Medicaid.
In reality, health insurance companies and government programs only pay for limited long‑term care services, and many long‑term care expenses are absorbed by individuals and families.4 Yet few younger adults approve of this status quo—29 percent say individuals should bear the costs, and 28 percent say families should have a large responsibility. Compared to younger adults, those age 40 and older place more of the financial burden on individuals (38 percent) but are less likely to feel families should be responsible (18 percent).
Adults of all ages lack confidence in their financial resources to pay for any care they need as they get older. Just sixteen percent of adults age 18 to 39 and 17 percent of those age 40 or older think they will have enough funds to pay for their own future long‑term care needs.
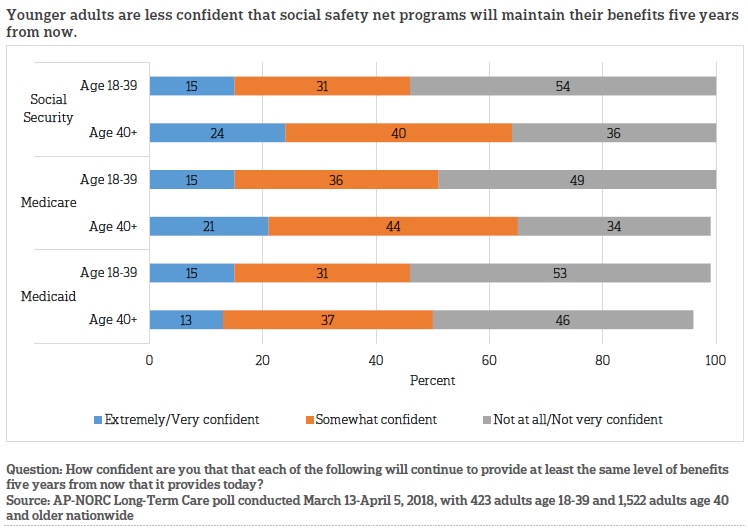
As for the future of Social Security, Medicare, and Medicaid, just 15 percent of younger adults are confident that each of these programs will provide the same level of benefits five years from now that they do today. Compared with adults age 40 and older, younger adults are more likely to say they have little or no faith that Social Security (54 percent vs. 36 percent) or Medicare (49 percent vs. 34 percent) benefits will be the same a few years down the road.
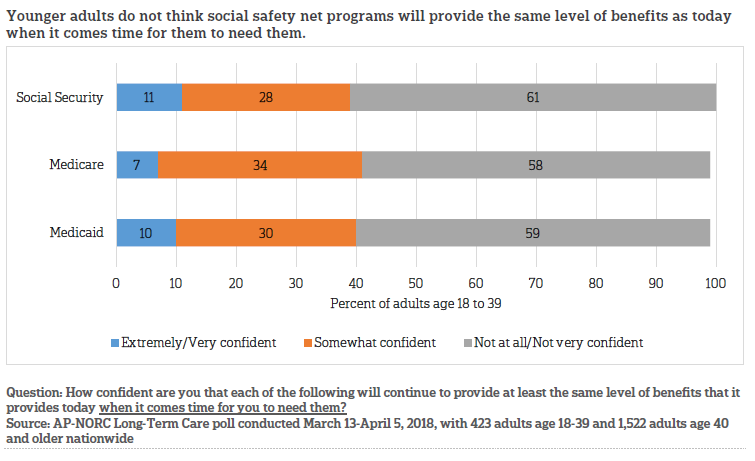
Younger adults are even less confident when thinking further down the line. Six in 10 say Social Security, Medicare, and Medicaid are not likely to maintain their level of benefits when it comes time for them to need these programs.
A Variety Of Proposals To Help Alleviate The Costs Of Long-Term Care Enjoy Support From A Majority Of Younger Adults.ꜛ
In February 2018, Congress passed the Creating High‑Quality Results and Outcomes Necessary to Improve (CHRONIC) Care Act, which will allow Medicare Advantage to cover more services for people who need a lot of long‑term care.5 A majority of adults age 18 to 39 favor this legislation. Sixty‑five percent support allowing individuals to get long‑term care insurance through a Medicare Advantage or supplemental insurance plan.
About 6 in 10 younger adults express support for several other proposals designed to help Americans prepare for the costs associated with long‑term care. Tax breaks for purchasing long‑term care insurance and the ability for individuals to purchase long‑term care insurance through their employer that is portable, similar to COBRA, are the most popular, with 62 percent of younger adults in favor of each.
Compared with adults age 40 and older, younger adults express lower levels of support for each of the five policy proposals and are more likely to say they neither favor nor oppose the policies. The largest gap in opinion comes on the proposal to give individuals long‑term care coverage through Medicare Advantage or supplemental insurance plans, as outlined in the recently passed CHRONIC Care Act.
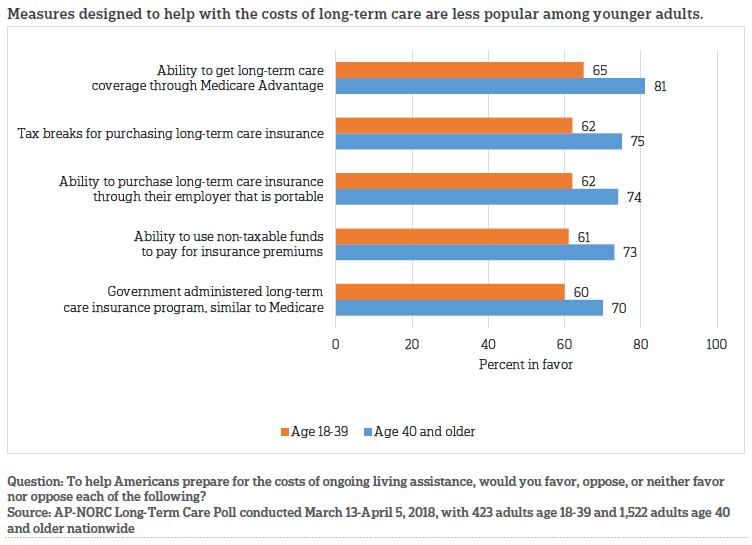
Young Democrats are more likely than Republicans to express support for a government‑administered long‑term care insurance program (70 percent vs. 49 percent) and the ability to get long‑term care insurance through a Medicare Advantage or supplemental insurance plan (76 percent vs. 59 percent), but they are no more likely to support each of the other three policy proposals.
Proposals aimed at helping Americans who are caregivers with the costs of providing long‑term care are also popular among younger adults. Again, in comparison to adults age 40 and older, younger adults express lower levels of support and are more likely to neither favor nor oppose each of the five policy proposals designed to lessen the financial impact on caregivers.
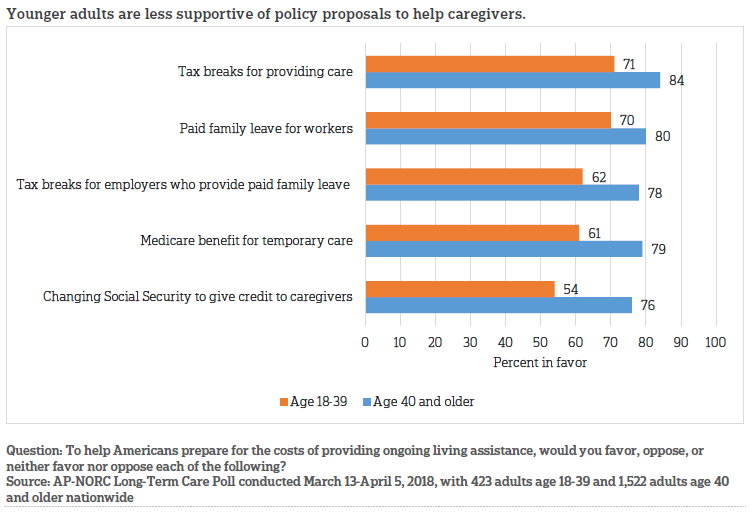
Among younger adults, Democrats and Republicans express similar levels of support for each of the proposals except for the Medicare benefit that provides temporary care if the caregiver and the care recipient live together and are both Medicare beneficiaries. Seventy‑two percent of Democrats support this proposal compared with 49 percent of Republicans.
Most Younger Adults Think Employers Should Offer Long-Term Care Insurance Plans As A Workplace Benefit.ꜛ
Eighty‑one percent of adults age 18 to 39 think that employers should offer employees long‑term care insurance plans as a benefit, similar to how some employers offer health, dental, or vision insurance. Among those who believe long‑term care insurance should be part of a benefits package, two‑thirds say it should be an opt‑in benefit, while one‑third believe employees should be automatically enrolled unless they opt out of the benefit.
Eleven percent of younger adults think they have long‑term care insurance coverage, and just 4 percent are certain that they have it. Adults age 40 and older are no more likely than younger adults to have long‑term care insurance.
About The Studyꜛ
Study Methodology
This study, funded by The SCAN Foundation, was conducted by The Associated Press‑NORC Center for Public Affairs Research. Data were collected using the AmeriSpeak® Panel, NORC’s probability‑based panel designed to be representative of the U.S. household population. During the initial recruitment phase of the panel, randomly selected U.S. households were sampled with a known, non‑zero probability of selection from the NORC National Sample Frame and then contacted by U.S. mail, email, telephone, and field interviewers (face‑to‑face). The panel provides sample coverage of approximately 97 percent of the U.S. household population. Those excluded from the sample include people with P.O. Box only addresses, some addresses not listed in the USPS Delivery Sequence File, and some newly constructed dwellings. Of note for this study, the panel may exclude recipients of long‑term care who live in some institutional types of settings, such as skilled nursing facilities or nursing homes, depending on how addresses are listed for the facility. Staff from NORC at the University of Chicago, The Associated Press, and The SCAN Foundation collaborated on all aspects of the study.
Interviews for this survey were conducted between March 13 and April 5, 2018, with adults age 18 and older representing the 50 states and the District of Columbia. Panel members were randomly drawn from AmeriSpeak, and 1,945 completed the survey—1,588 via the web and 357 via telephone. For purposes of analysis, all adults age 40 and older and Hispanic adults age 40 and older were sampled at a higher rate than their proportion of the population, then weighted back to their proper proportion in the survey, according to the most recent Census. Interviews were conducted in both English and Spanish, depending on respondent preference. Respondents were offered a small monetary incentive ($3) for completing the survey.
The final stage completion rate is 30.0 percent, the weighted household panel response rate is 33.7 percent, and the weighted household panel retention rate is 88.1 percent, for a cumulative AAPOR response rate 3 of 8.9 percent. The overall margin of sampling error is +/‑ 3.3 percentage points at the 95 percent confidence level, including the design effect. The margin of sampling error for the 1,522 completed interviews with adults age 40 and older is +/‑ 3.3 percentage points at the 95 percent confidence level, including the design effect. The margin of sampling error for the 458 completed interviews with Hispanic adults age 18 and older is +/‑ 9.5 percentage points at the 95 percent confidence level, including the design effect. The margin of sampling error for the 423 completed interviews with adults age 18 to 39 is +/‑ 6.7 percentage points at the 95 percent confidence level, including the design effect.
Once the sample has been selected and fielded, and all the study data have been collected and made final, a poststratification process is used to adjust for any survey nonresponse as well as any non‑coverage or under‑ and oversampling resulting from the study specific sample design. Poststratification variables included age, gender, census division, race/ethnicity, and education. Weighting variables were obtained from the 2017 Current Population Survey. The weighted data reflect the U.S. population of adults age 18 and over.
All analyses were conducted using STATA (version 14), which allows for adjustment of standard errors for complex sample designs. All differences reported between subgroups of the U.S. population are at the 95 percent level of statistical significance, meaning that there is only a 5 percent (or less) probability that the observed differences could be attributed to chance variation in sampling. Additionally, bivariate differences between subgroups are only reported when they also remain robust in a multivariate model controlling for other demographic, political, and socioeconomic covariates.
A comprehensive listing of all study questions, complete with tabulations of top‑level results for each question, is available on The AP‑NORC Center for Public Affairs Research long‑term care website: www.longtermcarepoll.org. For more information, email info@apnorc.org.
Contributing Researchers
From NORC at the University of Chicago
Jennifer Benz
Jennifer Titus
Dan Malato
Liz Kantor
Emily Alvarez
Jessica Bielenberg
Trevor Tompson
From The Associated Press
Emily Swanson
About The Associated Press‑NORC Center for Public Affairs Research
The AP‑NORC Center for Public Affairs Research taps into the power of social science research and the highest‑quality journalism to bring key information to people across the nation and throughout the world.
- The Associated Press (AP) is the world’s essential news organization, bringing fast, unbiased news to all media platforms and formats.
- NORC at the University of Chicago is one of the oldest and most respected, independent research institutions in the world.
The two organizations have established The AP‑NORC Center for Public Affairs Research to conduct, analyze, and distribute social science research in the public interest on newsworthy topics, and to use the power of journalism to tell the stories that research reveals.
The founding principles of The AP‑NORC Center include a mandate to carefully preserve and protect the scientific integrity and objectivity of NORC and the journalistic independence of AP. All work conducted by the Center conforms to the highest levels of scientific integrity to prevent any real or perceived bias in the research. All of the work of the Center is subject to review by its advisory committee to help ensure it meets these standards. The Center will publicize the results of all studies and make all datasets and study documentation available to scholars and the public.
Footnotesꜛ
1. U.S. Department of Health and Human Services. 2017. How Much Care Will You Need?
https://longtermcare.acl.gov/the‑basics/how‑much‑care‑will‑you‑need.htmlꜛ
2. The AP‑NORC Center for Public Affairs Research. 2017. Long‑Term Care in America: Views on Who Should Bear the Responsibilities and Costs of Care. https://www.longtermcarepoll.org/project/long‑term‑care‑in‑america‑views‑on‑who‑should‑bear‑the‑responsibilities‑and‑costs‑of‑care/ꜛ
3. U.S. Department of Health and Human Services. 2017. How Much Care Will You Need?
https://longtermcare.acl.gov/the‑basics/how‑much‑care‑will‑you‑need.htmlꜛ
4. U.S. Department of Health and Human Services. 2017. Who Pays for Long-Term Care? https://longtermcare.acl.gov/the-basics/who-pays-for-long-term-care.html ꜛ
5. Bipartisan Budget Act of 2018, Pub. L.115‑ 123(2018). https://www.congress.gov/115/bills/hr1892/BILLS-115hr1892enr.pdfꜛ